See the Whole Market.
Act First.
Athenum unifies order flow, open interest, and liquidity data from 14+ exchanges into a single workspace. Stop juggling tabs. Start trading with the full picture.
You Deserve Better Than This
Fragmented View
You pay for four subscriptions and still can't see what's happening across exchanges. Your heatmap shows one venue. Your order flow tool shows another. By the time you alt-tab to confirm, the move already happened.
Crashes When It Counts
The tools you rely on were never designed to work together. Fragmented data creates fragmented decisions. When volatility spikes, the platforms built on browser tabs and stitched-together APIs are the first to break.
A Rigged Information Game
Meanwhile, the information asymmetry keeps growing. Institutional desks see aggregated flow in real time. Retail traders see it seconds later, filtered through a middleman, on a dashboard that crashes when it matters most.
This is not a feature gap.
It is an infrastructure problem.
Built for traders who got tired of the workaround
One Tool. One View. One Source of Truth.
A single terminal that ingests live data from 14+ derivatives exchanges, normalizes it in real time, and renders it in a workspace you actually control.

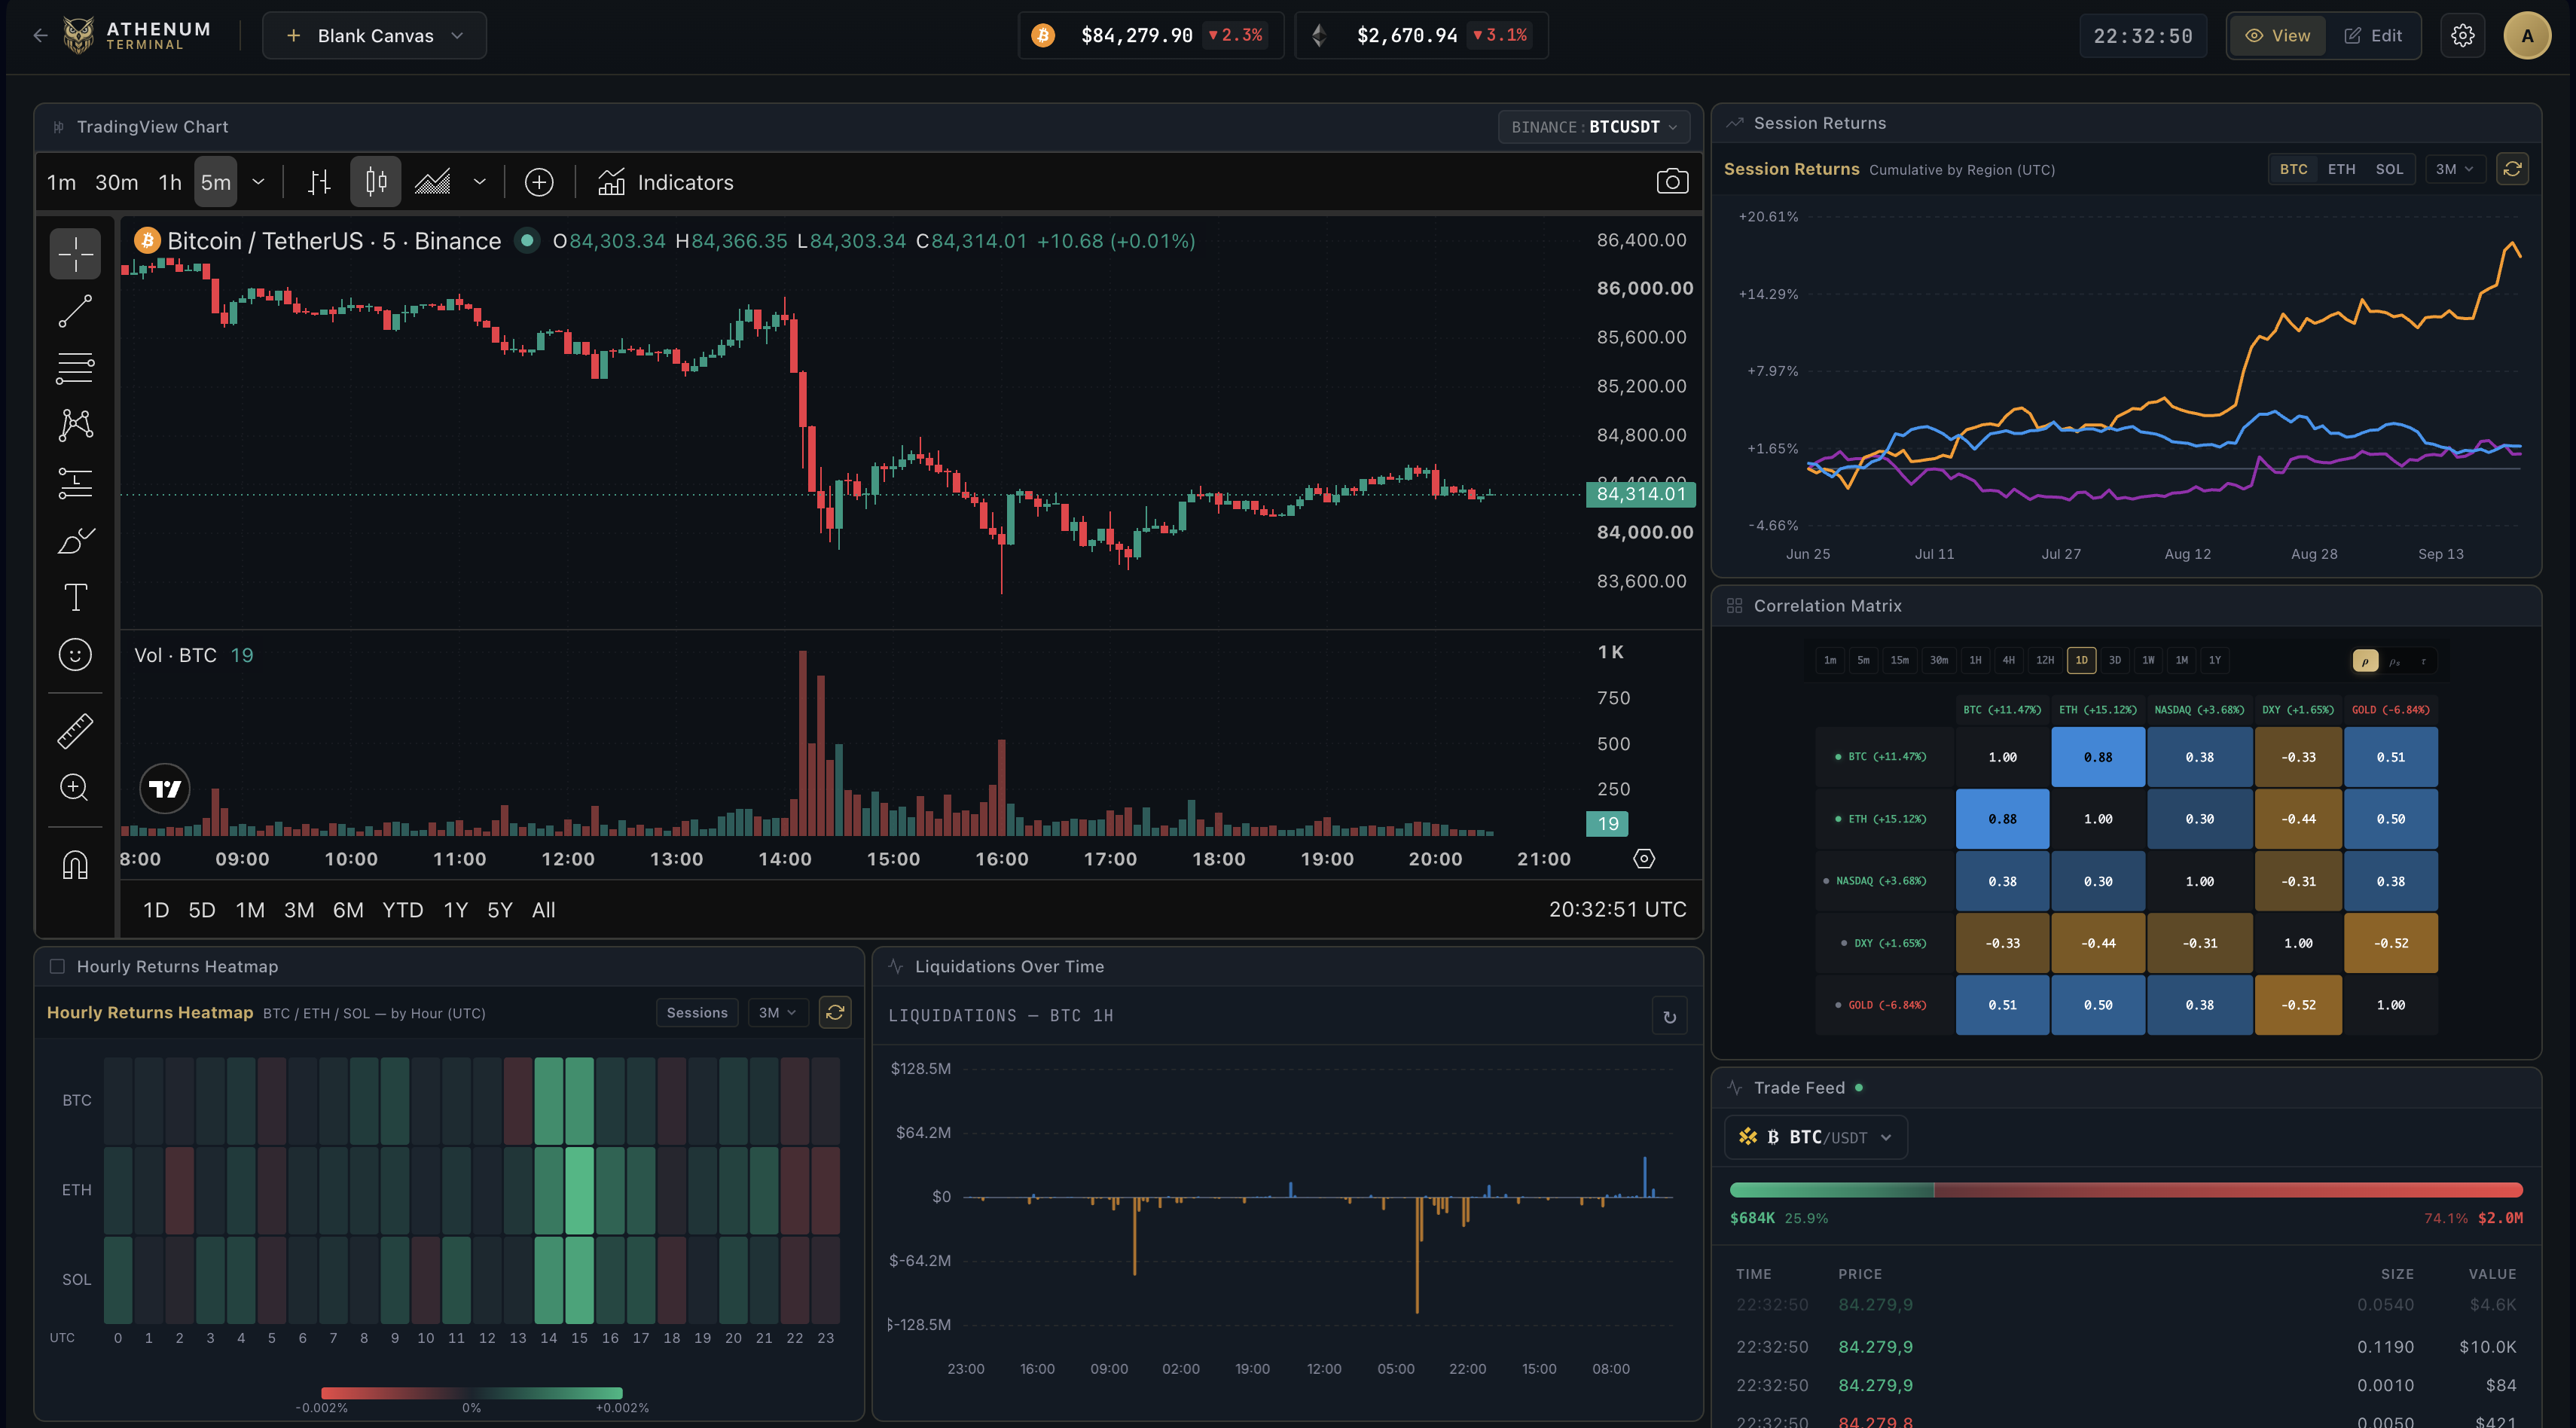
The Terminal
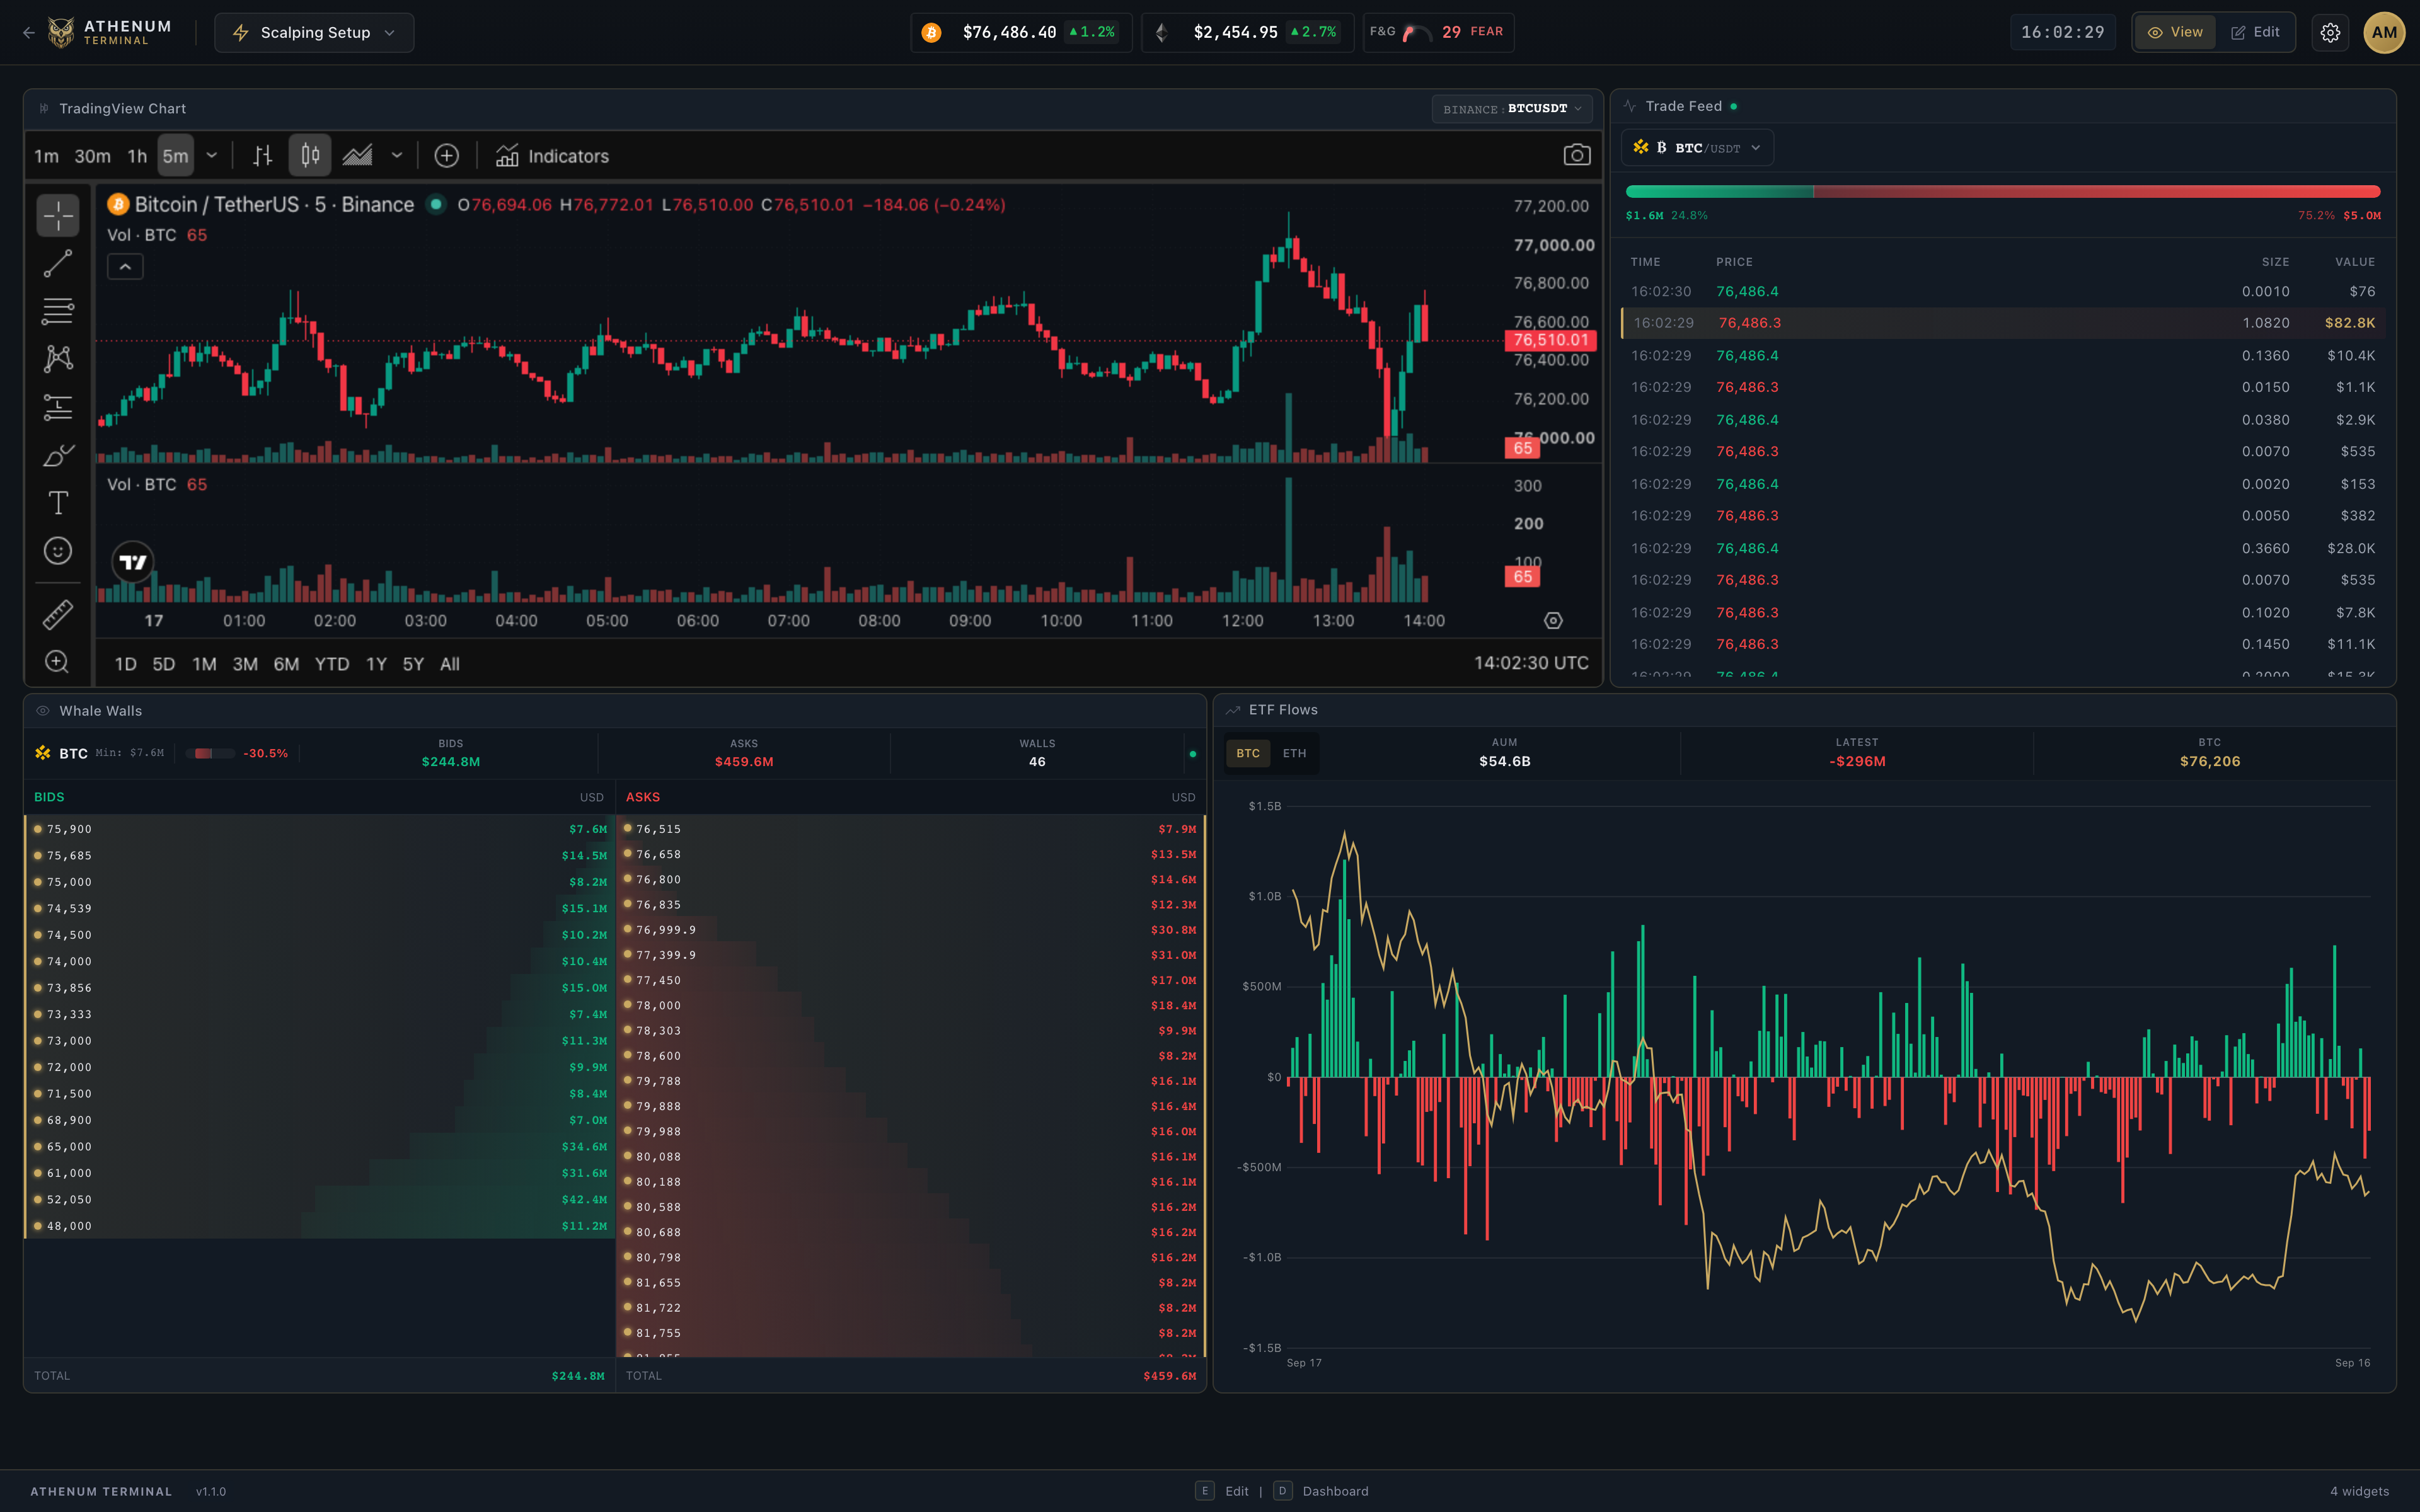
One workspace. Every data source. Arranged exactly how you want it.

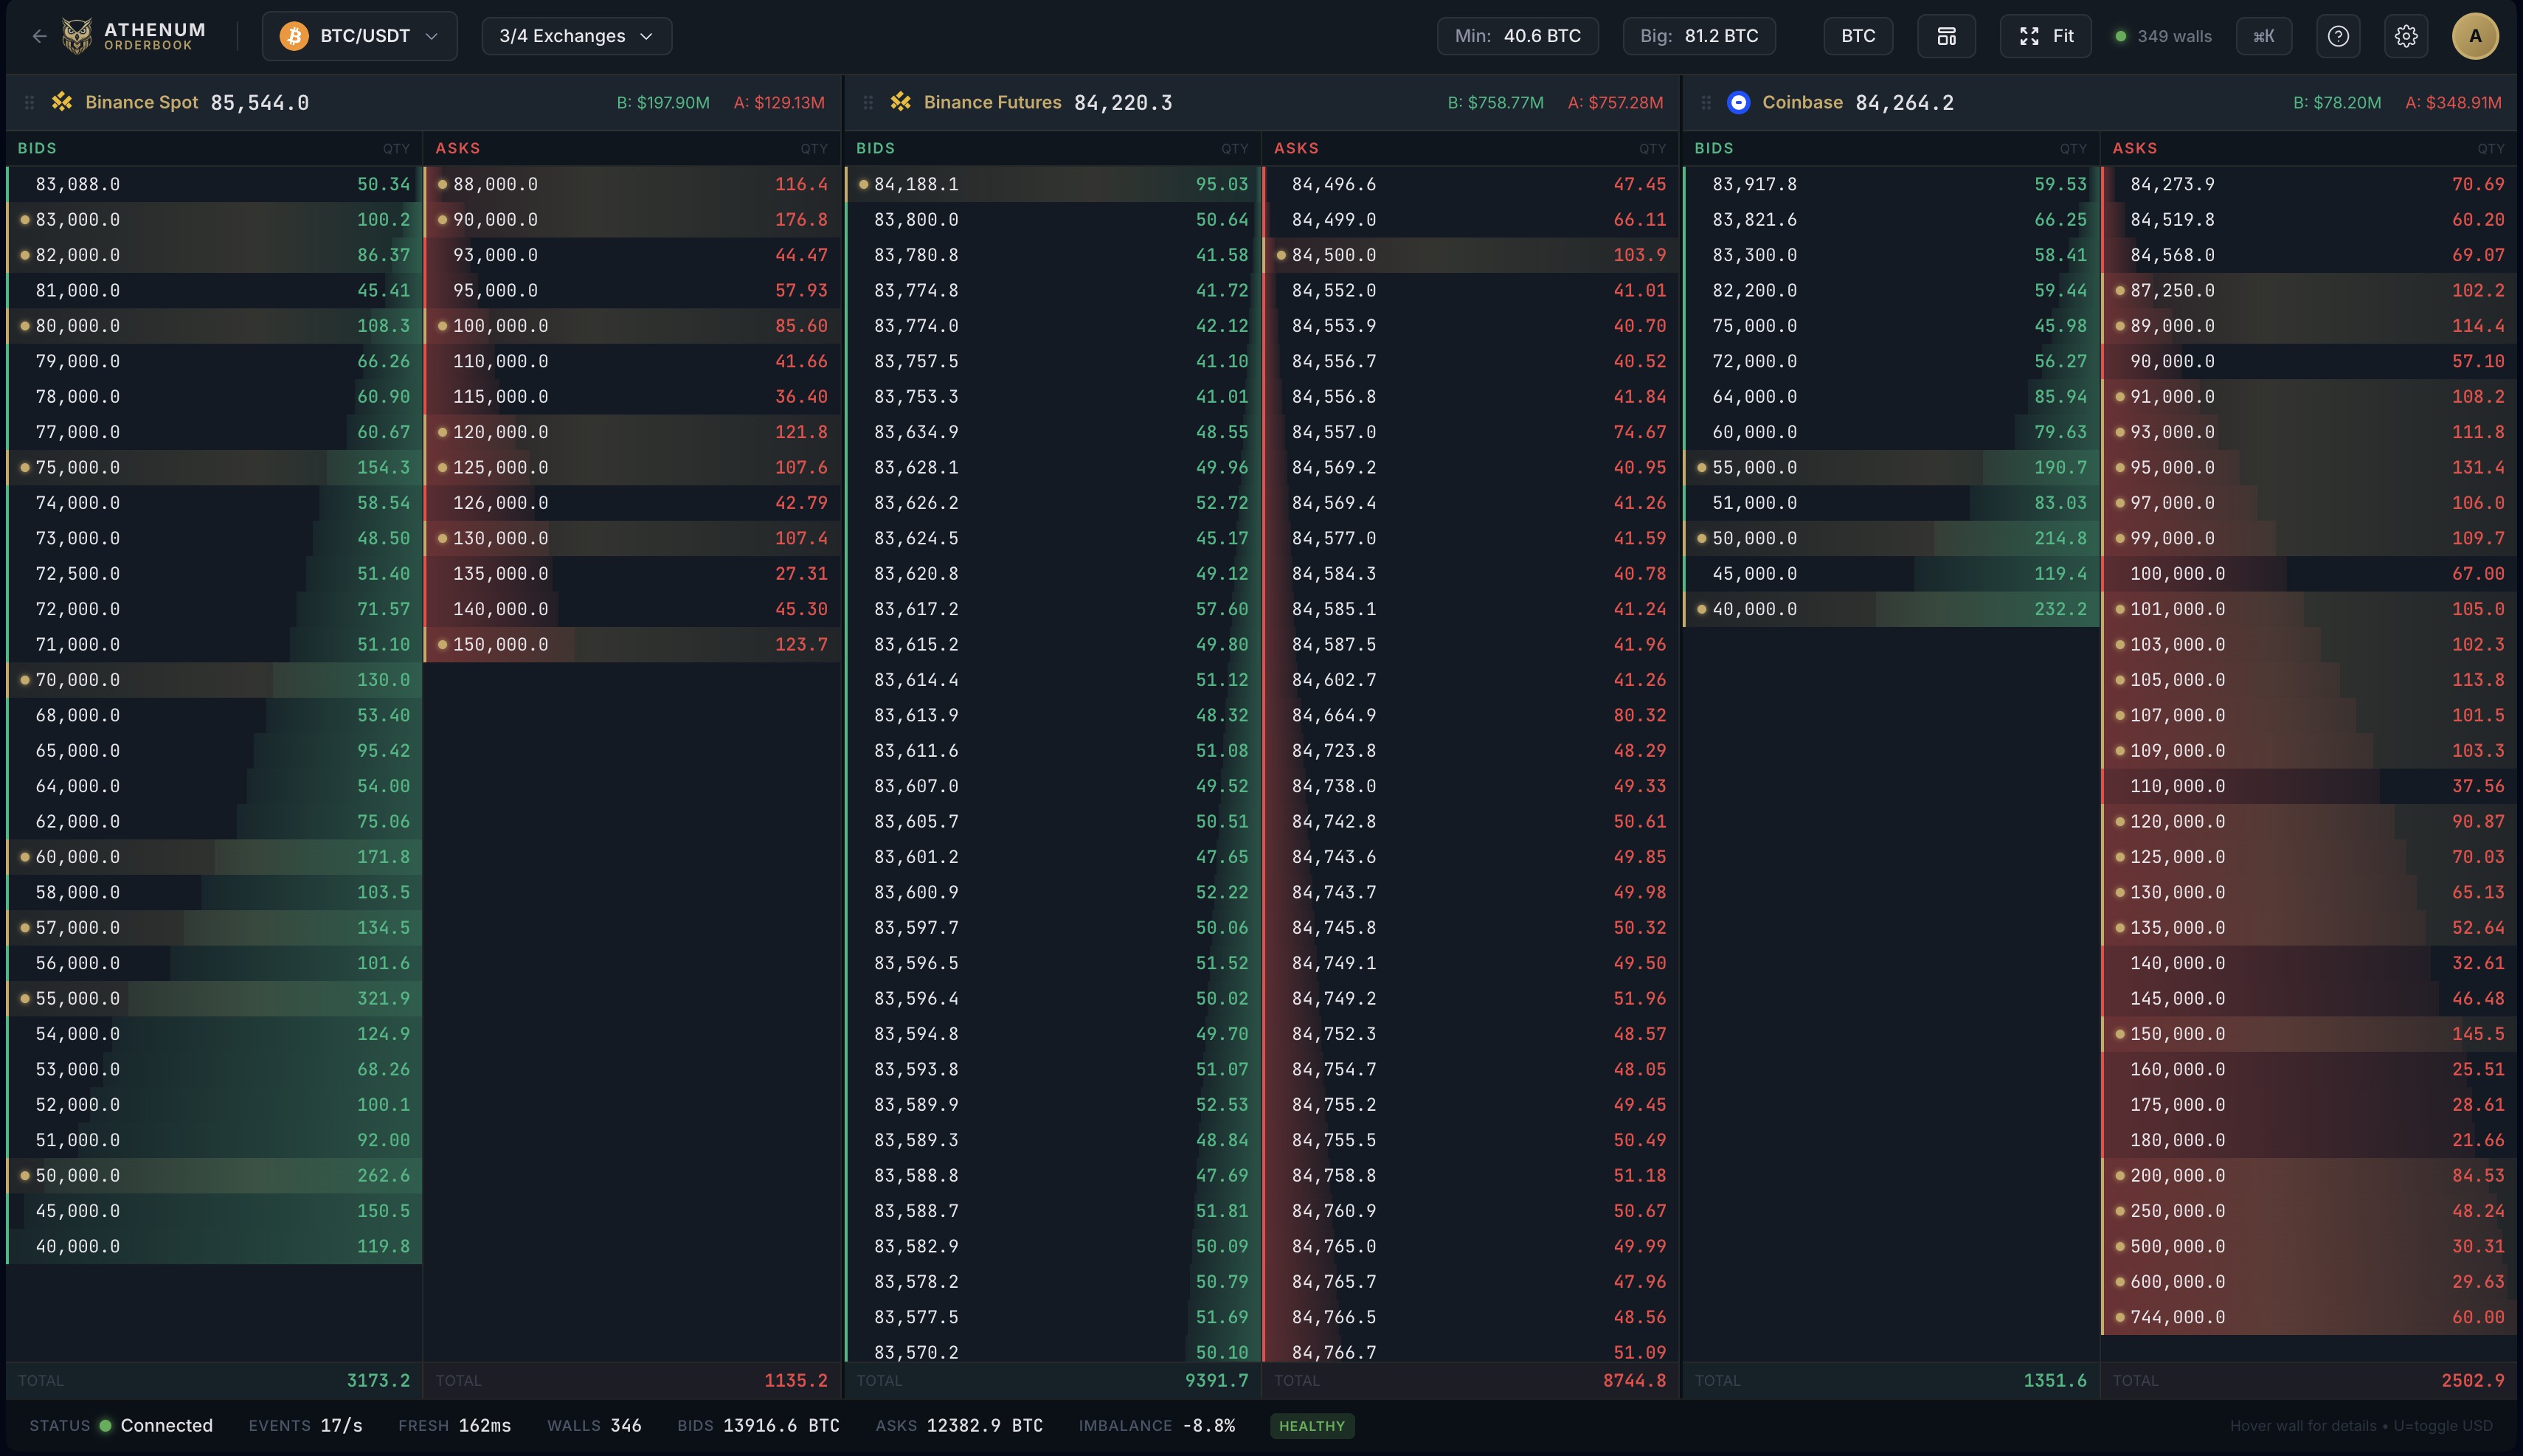
Market Depth
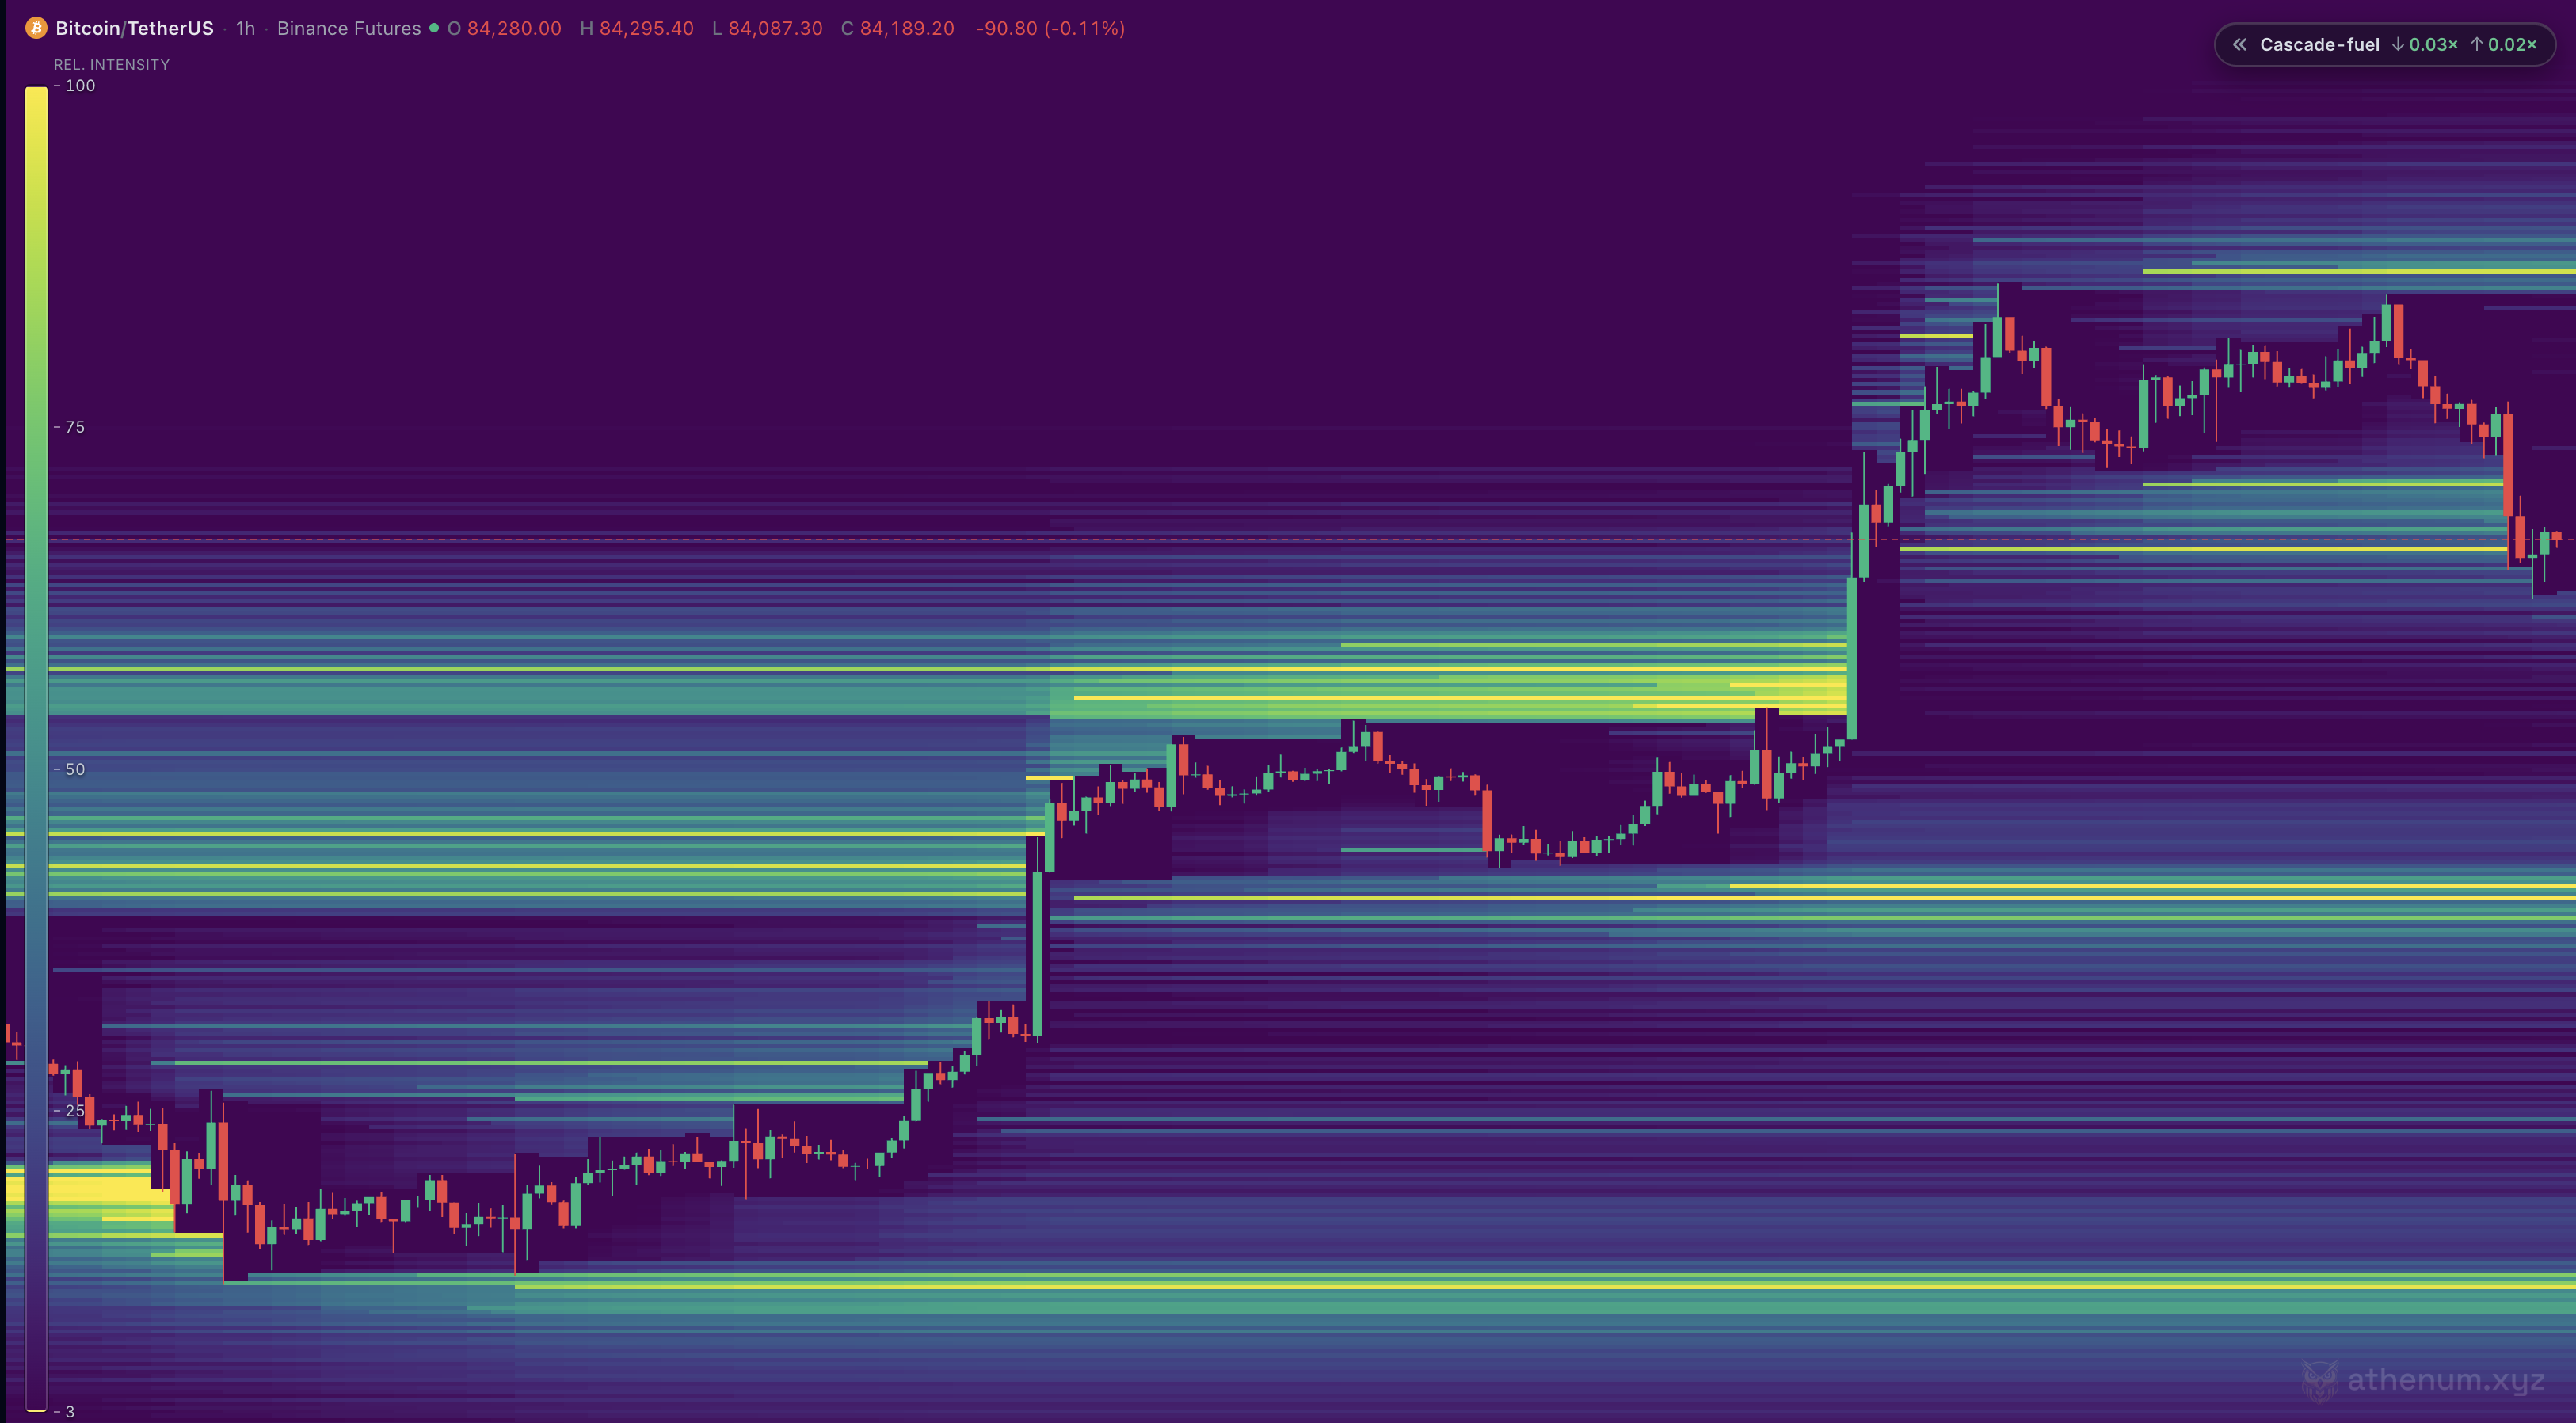
Whale walls and open interest across 14 exchanges. Real time.

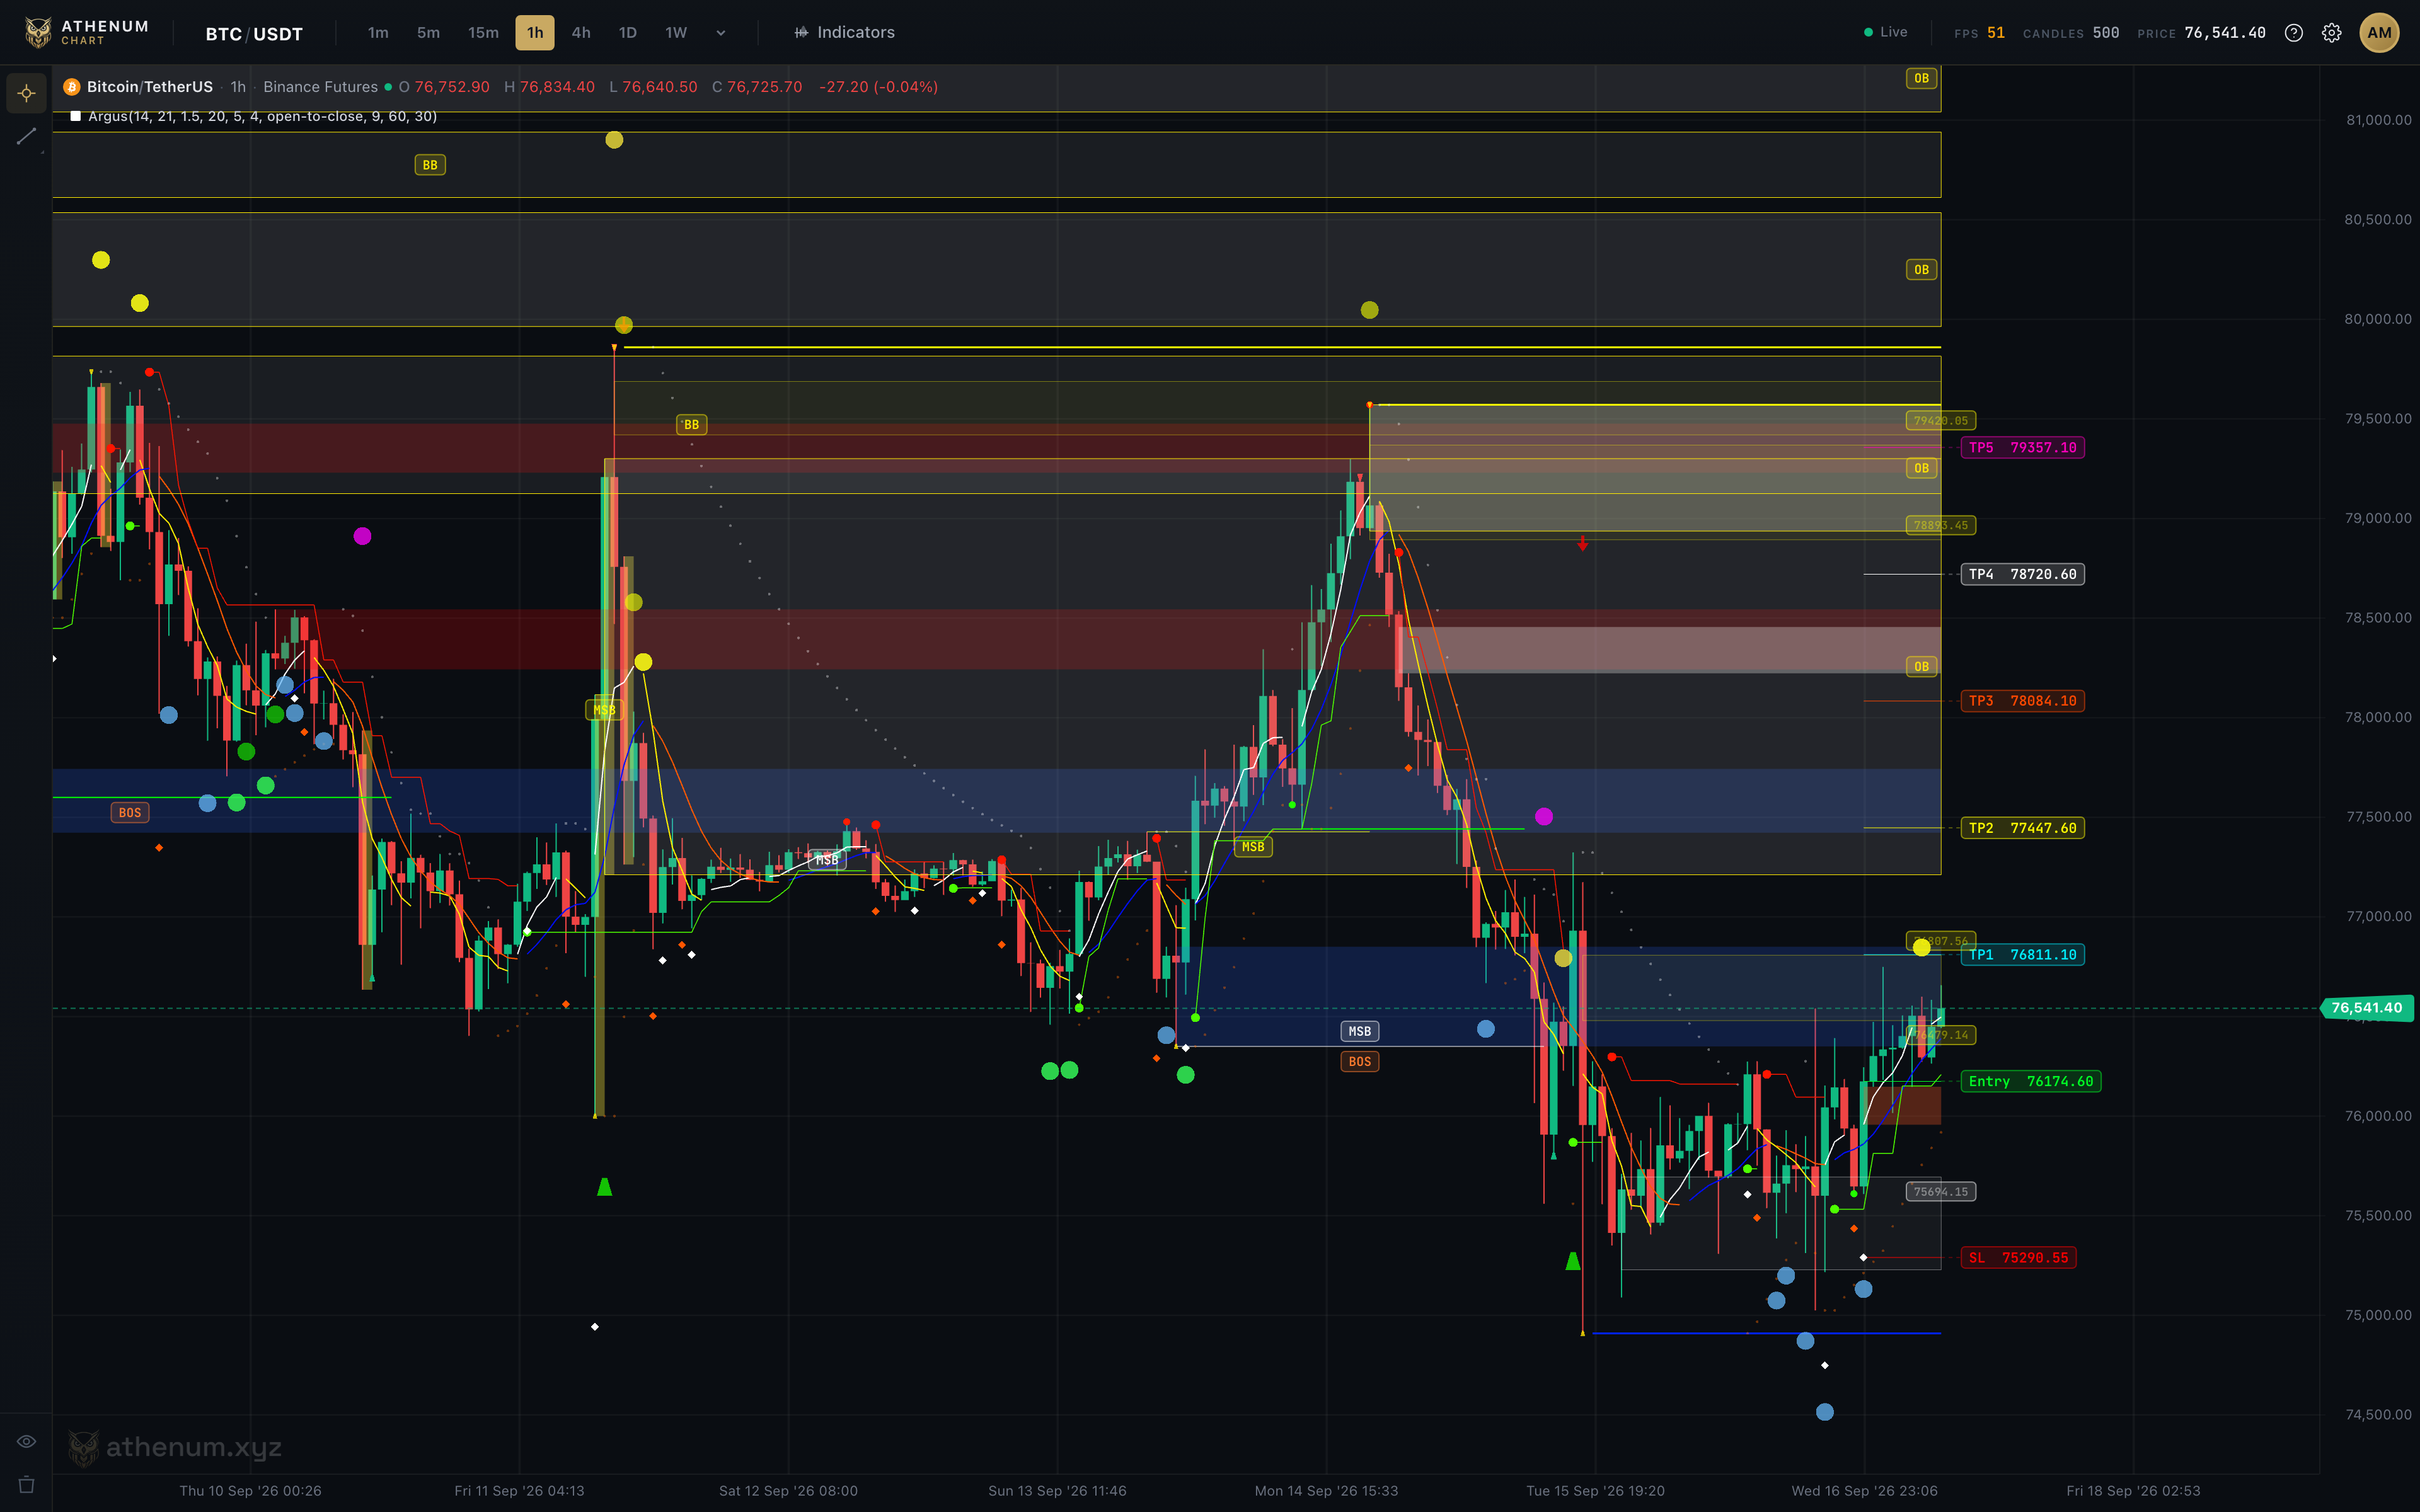
Argus Indicators
Automated market structure analysis on a GPU-native chart engine.

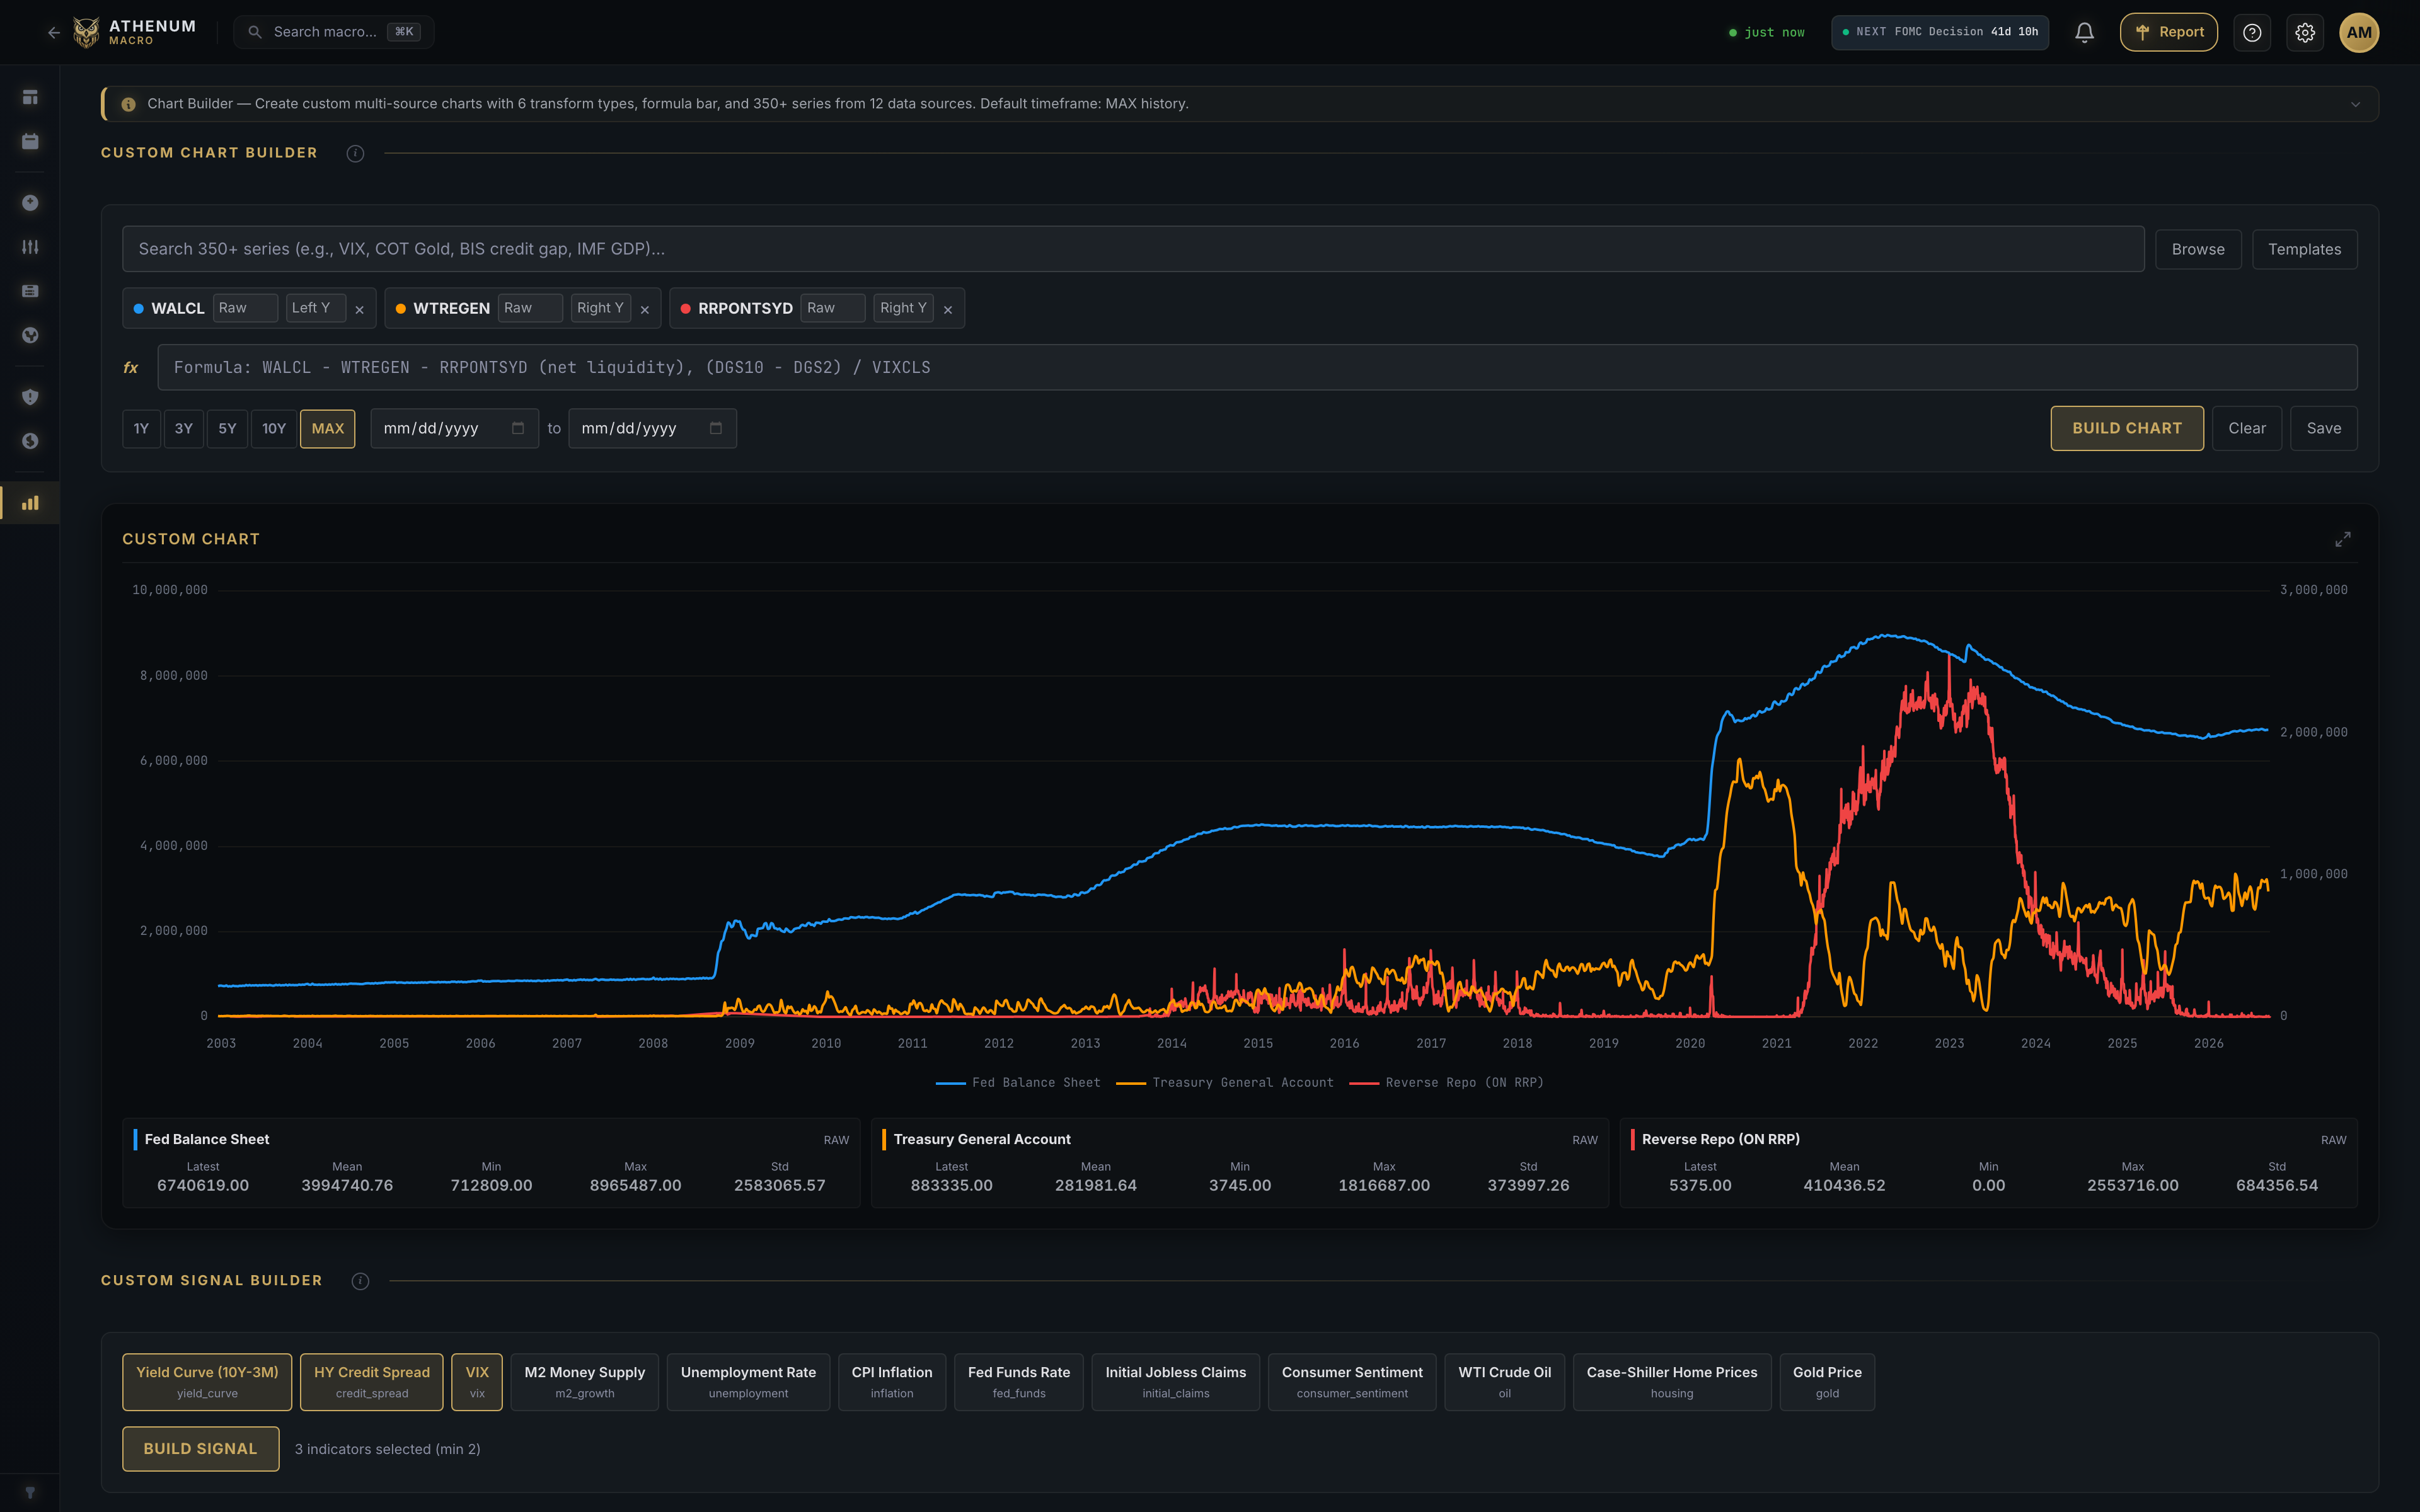
Macro Intelligence
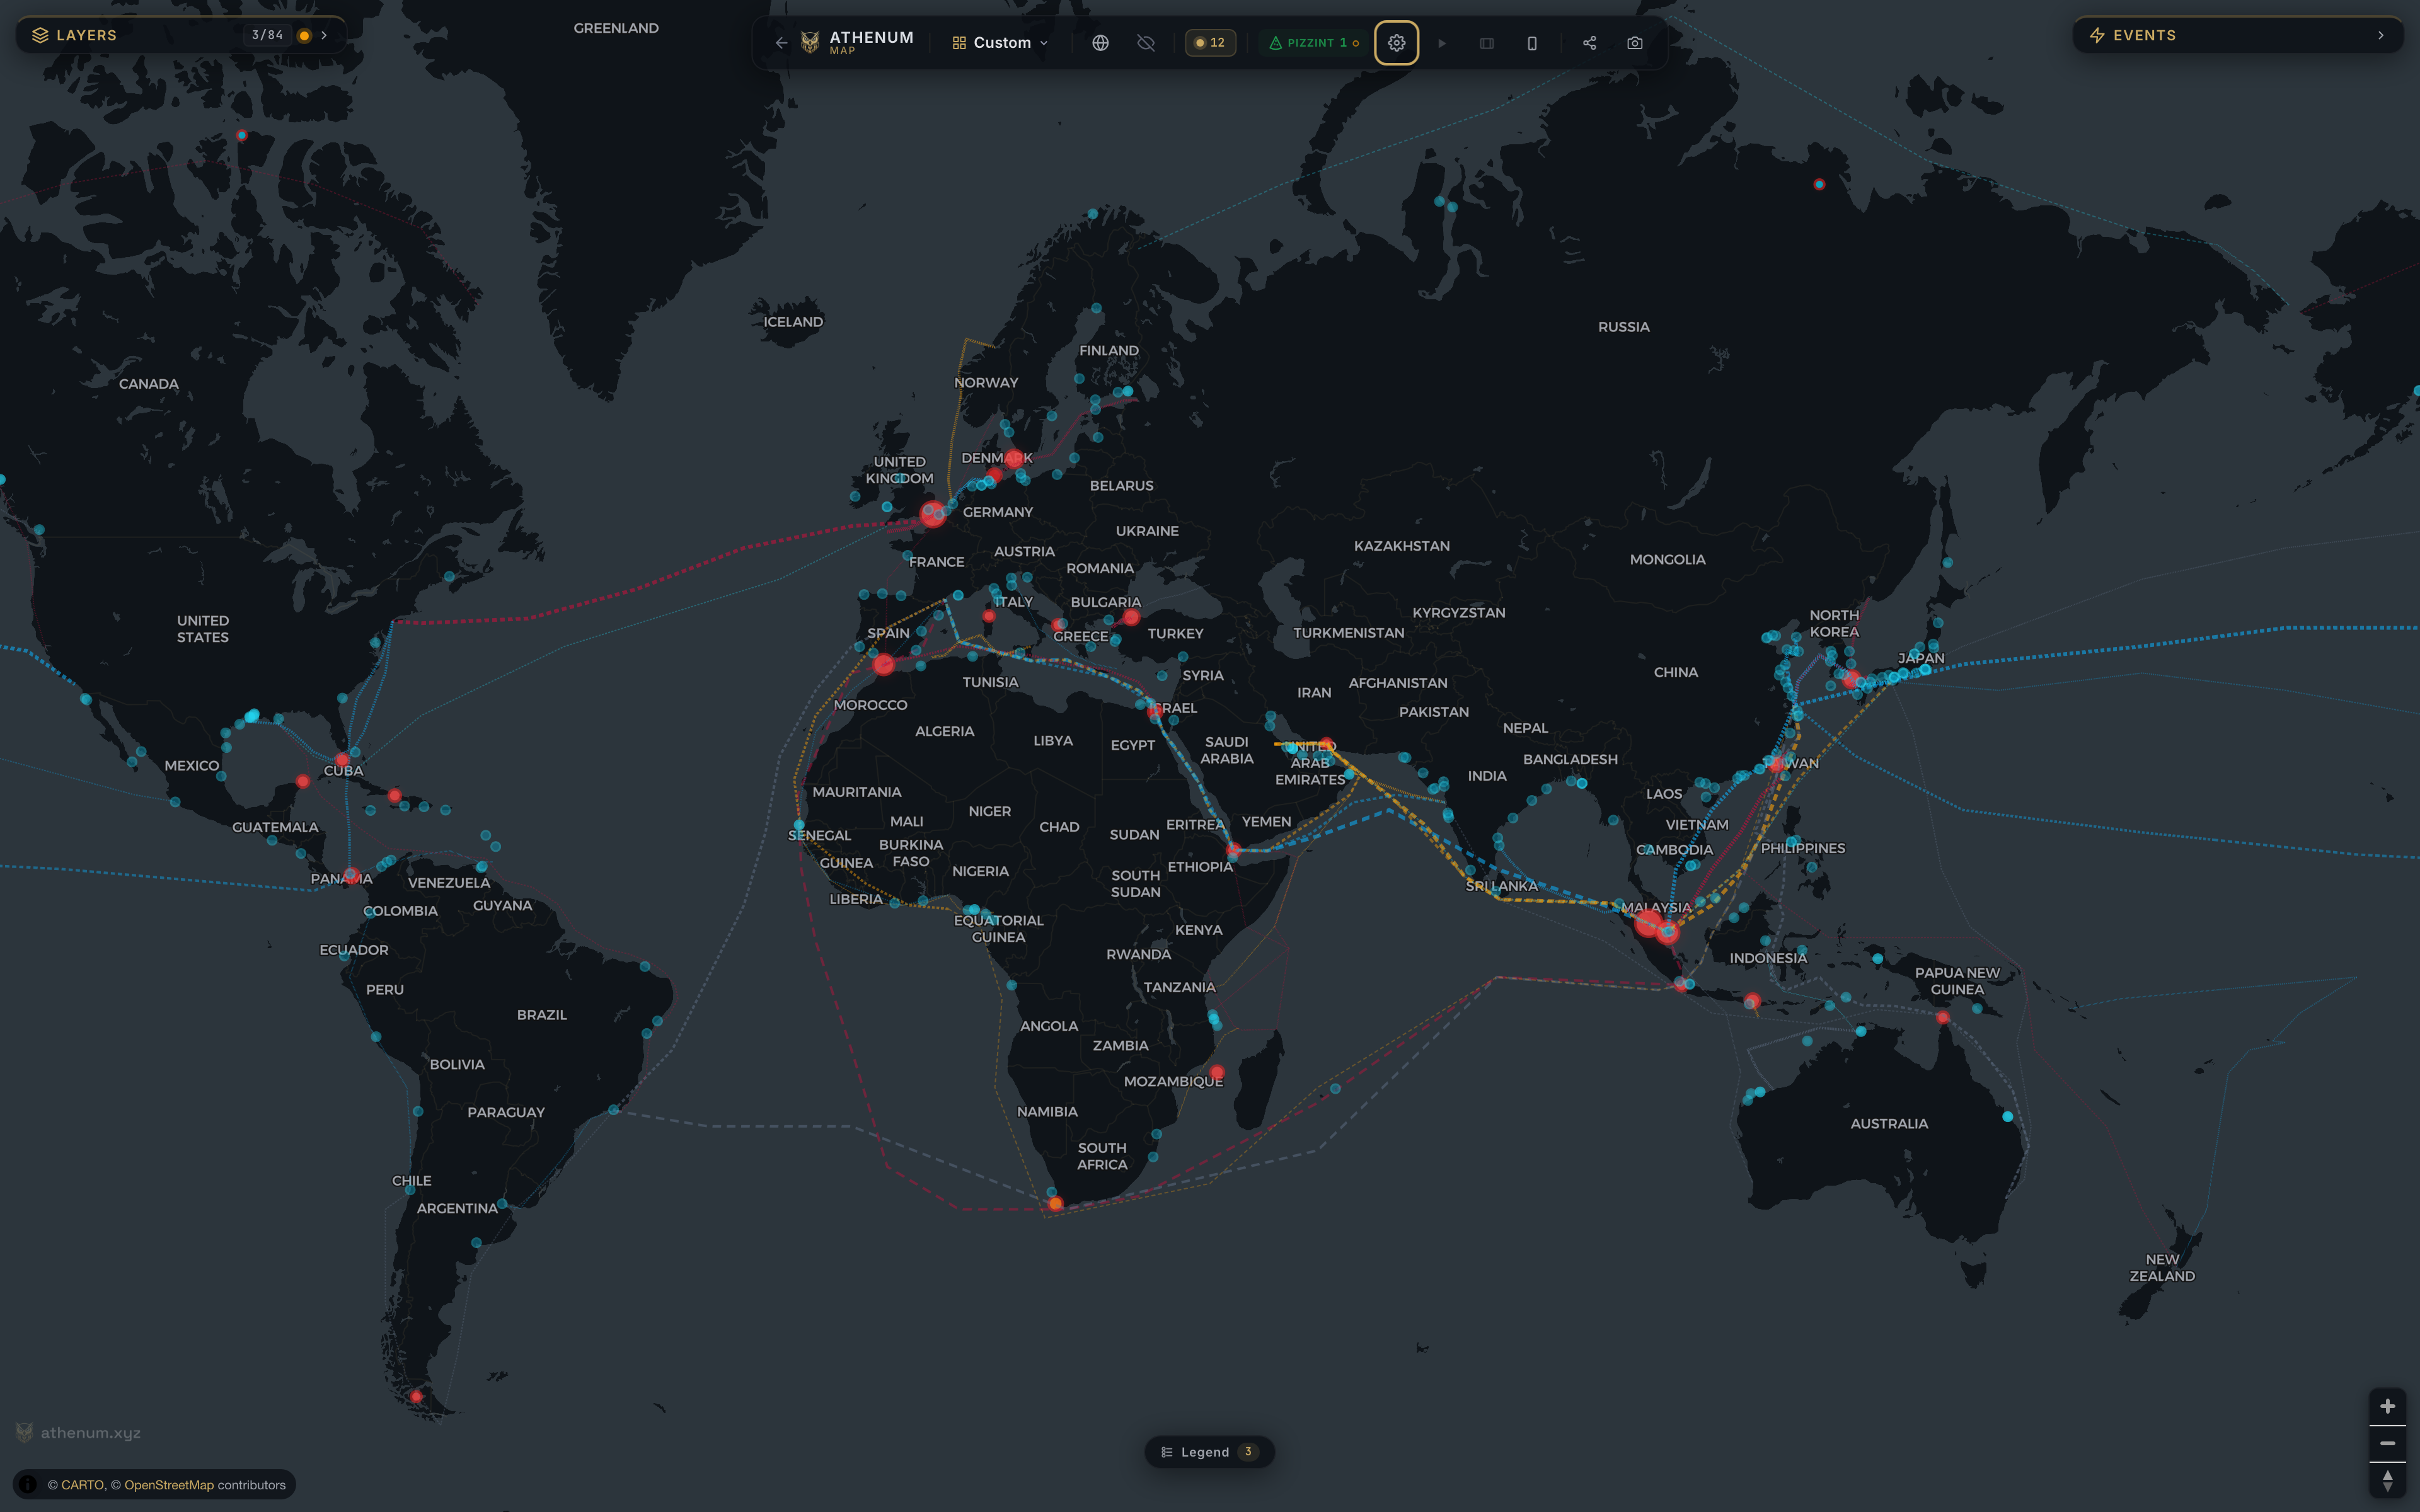
84 intelligence layers on a live world map. Geopolitical risk, visualized.
Prediction Markets
Polymarket and Kalshi in one terminal. Arbitrage, signals, execution.
What you get
See It in Action
Five capabilities that turn scattered data into a decisive edge. Each one built to work alone, or together in a single workspace.
Your Entire Edge. One Screen.
Build the exact workspace your strategy demands. Drag, resize, and arrange live widgets like order flow, whale walls, ETF flows, options, and correlation, then save your layouts to the cloud. No more tab-switching. No more paying for four tools that don't talk to each other.
See Where the Big Money Sits
Whale walls and open interest mapped across 14 exchanges, updating in real time. You see where institutions are positioned and where new size is stacking before price reacts.
Your Markup, Done Before You Open the Chart
Structure breaks, order blocks, FVGs, liquidity sweeps. Detected and drawn in real time on a GPU-native engine. The analysis you used to do by hand now runs automatically, across every timeframe, without a single PineScript dependency.
The Map Institutions Don't Want You To Have
84 intelligence layers. 26,000+ data points. Conflict zones, submarine cables, critical minerals, shipping lanes, nuclear assets, all on one live map. Track the geopolitical fault lines that move markets before the headlines catch up.
Every Edge. Both Platforms. One Screen.
Cross-platform arbitrage scanner, whale tape, alpha signals, and auto-execution across Polymarket and Kalshi, unified in a single terminal. Stop placing conviction bets by hand. Start running a systematic operation.
Every Exchange. One Terminal.
Nothing In Between.
Full access for 7 days. No credit card required.
The Status Quo vs. What's Possible
Today
Data. Separate tabs for each exchange. Alt-tab to compare.
Cost. $200+/mo stacked across 4-5 different subscriptions.
Speed. Seconds of delay through web-based aggregators.
Stability. Platform crashes during high volatility. Tools fail when you need them most.
Risk. Position sizing done by hand in external spreadsheets.
Learning. Dense jargon with no context. Tools create noise, not clarity.
With Athenum
Data. 14+ exchanges normalized into one live view.
Cost. One terminal. One subscription.
Speed. Sub-second data transport via direct WebSocket connections.
Stability. Streaming architecture that does not poll, batch, or collapse under pressure.
Risk. Built-in risk tools and correlation analysis, right on the chart.
Learning. Contextual overlays that explain patterns as they form.
From Fragmented to Focused in Three Steps
Create your account.
Sign up with email, Ethereum, or Solana wallet. No API keys. No exchange permissions. Athenum aggregates public market data through its own infrastructure.
See the full picture.
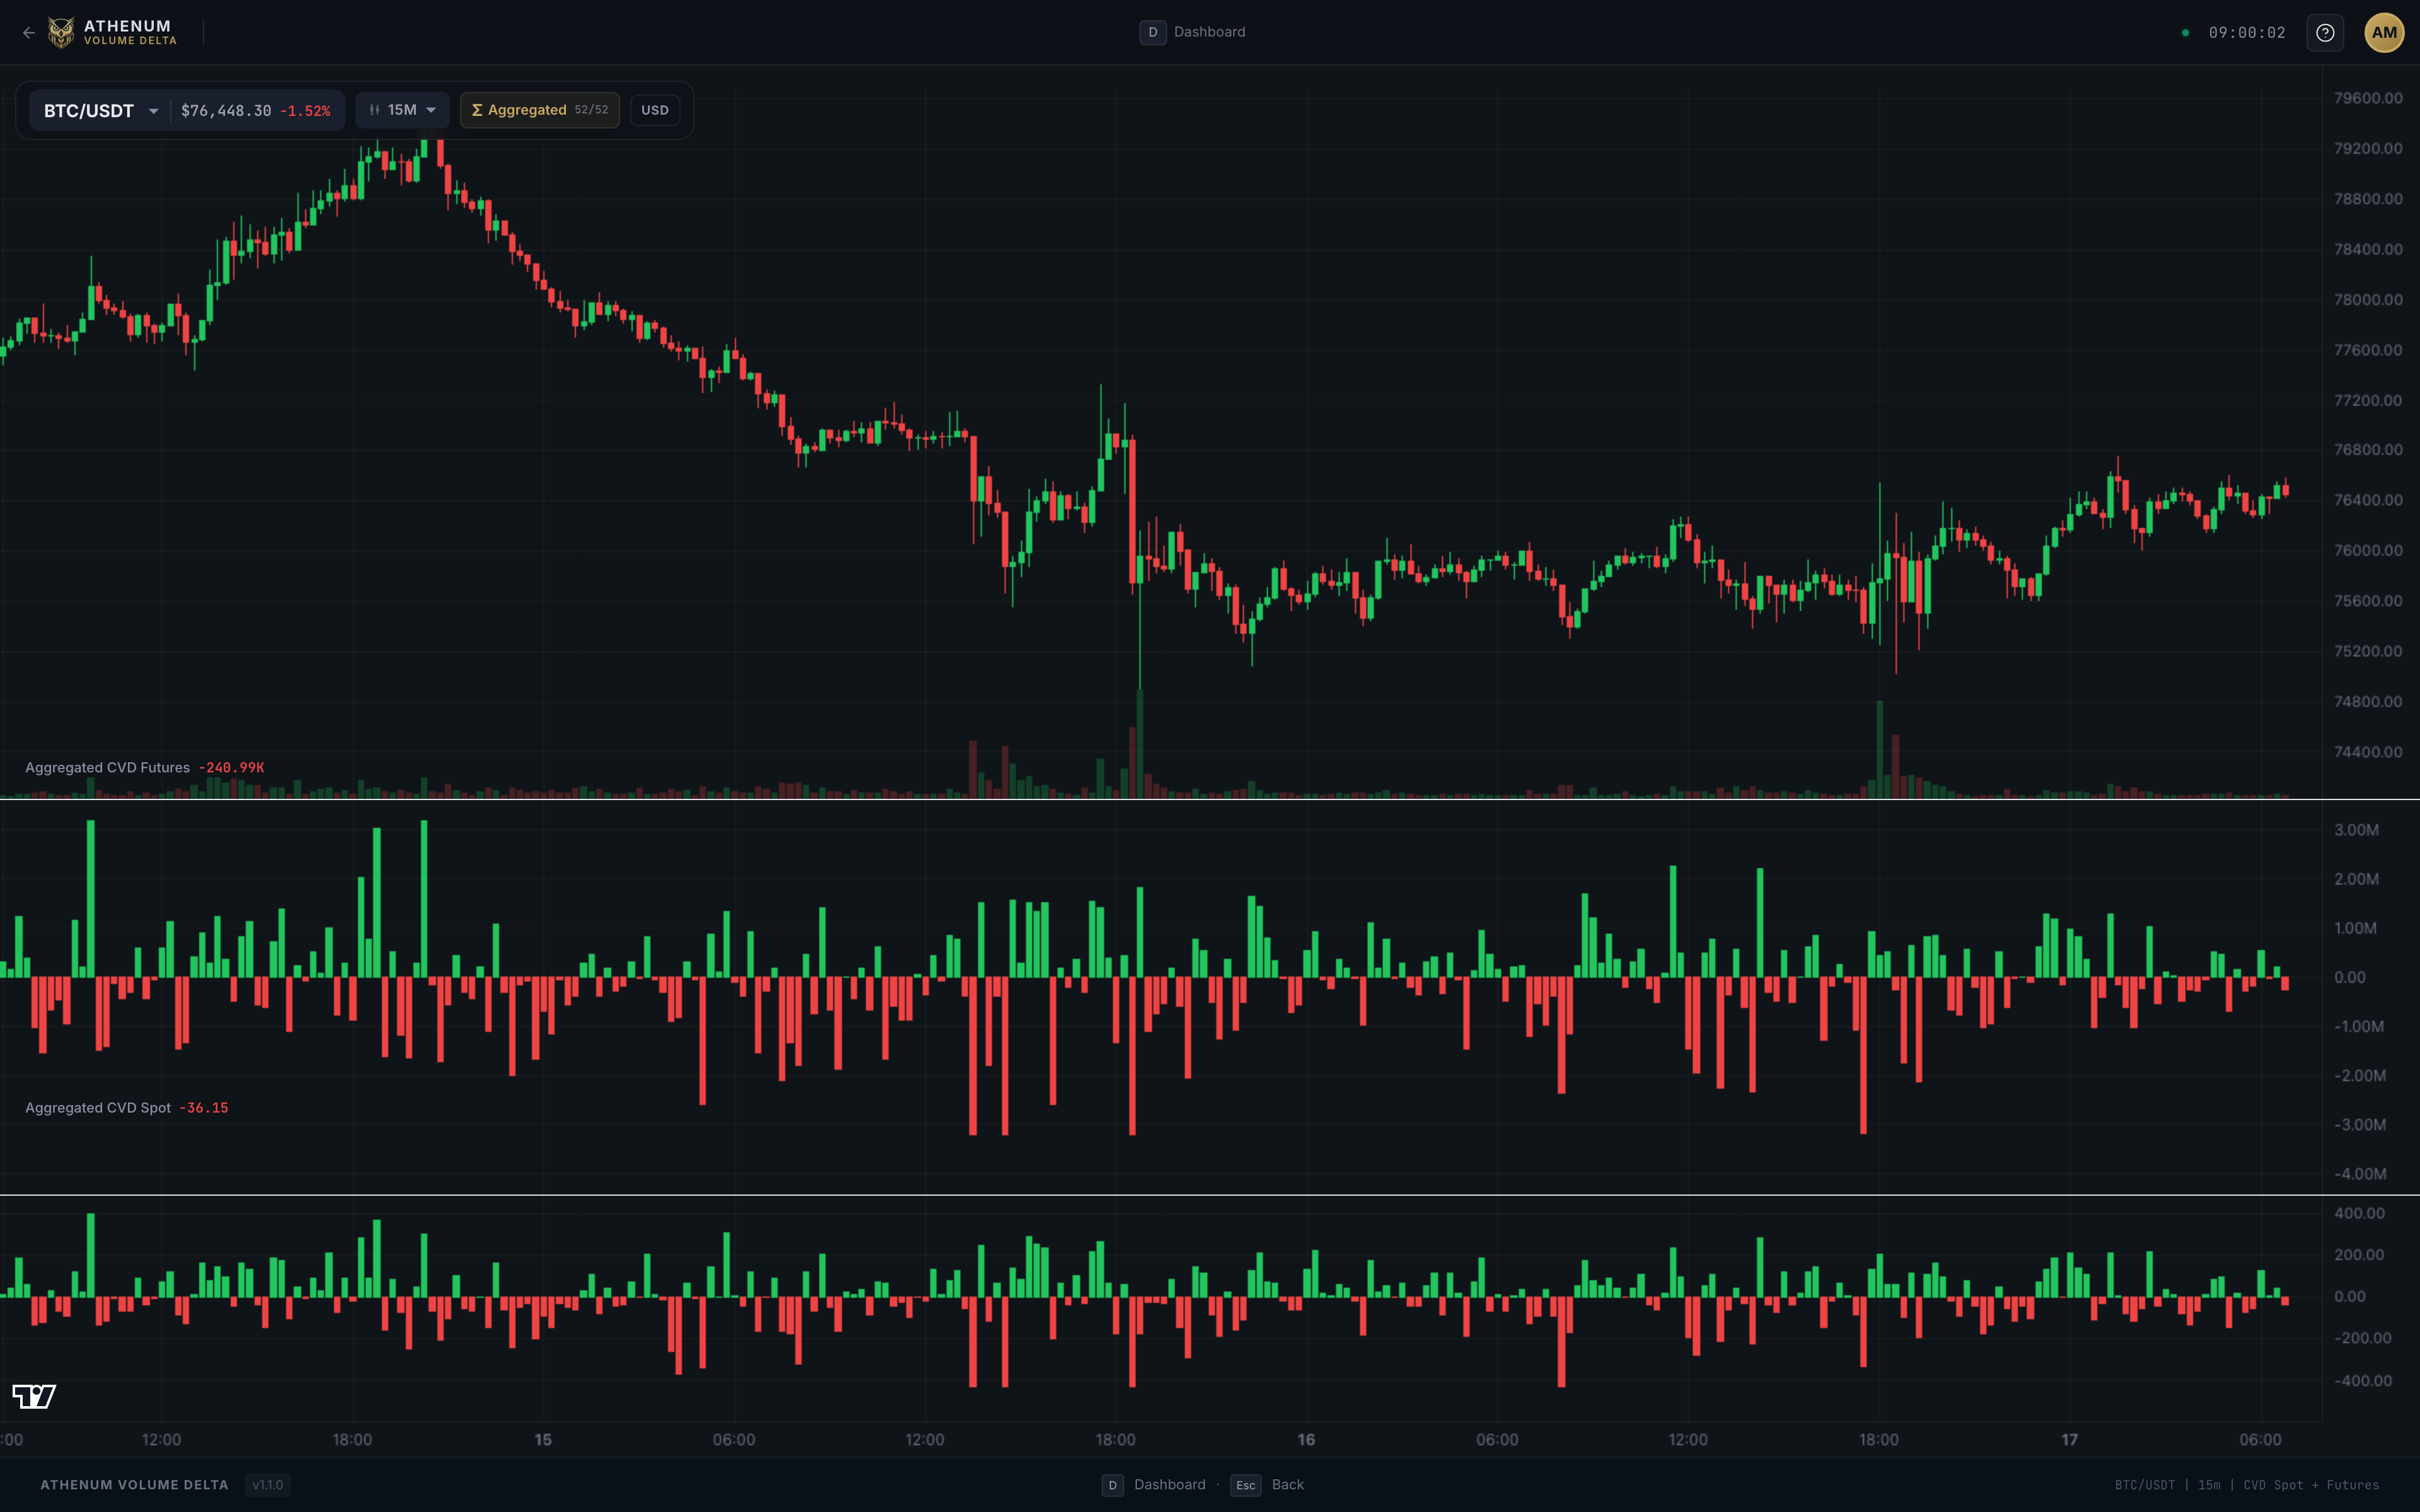
Whale walls, volume delta, funding rates, and open interest across up to 29 exchanges. Aggregated in real time by our backend. One dashboard, nothing stitched together.
Trade with conviction.
When a whale wall forms on Binance while OI diverges across venues, you see it first. No tab switching. No second-guessing which screen has the real data.

Analytics Ecosystem
Pick Your Alpha.
Five specialized analytical domains. Focus on what moves your needle.
Order Flow & Depth
See where the liquidity really sits

Derivatives Intelligence
Funding, basis, and positioning decoded

Macro & Institutional
The macro context most traders ignore

Prediction Markets
Event-driven alpha from Polymarket & Kalshi

Sentiment & Quant
NLP signals and cross-asset momentum

Simple, Transparent Pricing
One terminal. Choose your domains. Replace 3 subscriptions with one.
All plans remain available. Founder launch pricing currently applies only to Pro+ Monthly.
Free
Explore the terminal with essential tools
- Athenum Terminal access
- 1 analytics domain
- Delayed data (15-min)
- 3 exchanges
- 7 days of history
- Community access
Lite
For traders focused on a single domain
- Everything in Free
- Real-time data streaming
- All exchanges
- Full historical depth
- 20 custom alerts
- Priority support
Pro
For serious traders analyzing multiple markets
- Everything in Lite
- 3 analytics domains
- Cross-domain correlation
- 100 custom alerts
- Advanced export tools
- Early access to new features
Pro+
The complete Athenum experience, unrestricted
Founder rate grandfathered while your subscription remains active.
- Everything in Pro
- Unlimited Domains
- API access
- Unlimited alerts
- Dedicated support
- Custom integrations
Analytics Domains
Frequently Asked Questions
Everything you need to know about the platform, security, and pricing.
From the Blog
View all articles
Bitcoin Funding Rate vs Price: 0.72 to the Premium Index, 0.06 to the Move
The Bitcoin funding rate is the fee perpetual longs and shorts exchange every eight hours, and almost every description of it, ours included, says it measures crowding or conviction and then invites you to read that forward as a statement about price. This post tests only that second step. Measured on 2026-08-28 over 500 Binance BTCUSDT settlements back to 2026-03-15, the settled rate correlates +0.72 (95 percent interval +0.67 to +0.80) with the premium index it is built from.

Bitcoin Futures Roll: the Next Quarter Fills Before the Front One Drains
The Bitcoin futures roll is the moment traders move exposure out of an expiring contract and into the next one, and it does not look like the handover most people picture. Measured on 2026-08-26 at 08:52 UTC, about 30 days before the 2026-09-25 quarterly expiry, the December contract already held between 0.54 and 0.68 of September's open interest, median 0.61 across five boards.

Minimum Order Size on Bitcoin Perpetuals: $0.80 to $80.10 Across 14 Venues
Measured on 2026-08-25 at 08:33 UTC across the Bitcoin perpetual on 14 venues, the smallest order you are permitted to place runs from $0.80 on WOO X to $80.10 on Binance, and the fourteen land on just four levels: $0.80, $8.01, $10.00 and about $80.10. That converted table is the answer to the question as asked. The more useful finding is underneath it. The venues are not enforcing the same kind of rule.

Bitcoin Order Book Depth: One Exchange, Two Routes, 18 Times the Book
Every comparison of exchange liquidity starts by downloading an order book, and almost nobody checks that the download is a choice. Measured on 2026-08-23 across 11 public depth routes on six Bitcoin perpetual venues, 16 simultaneous snapshots each, the resting asks returned by one request run from 1.49M USD to 346.37M USD. The largest single gap is not between exchanges.

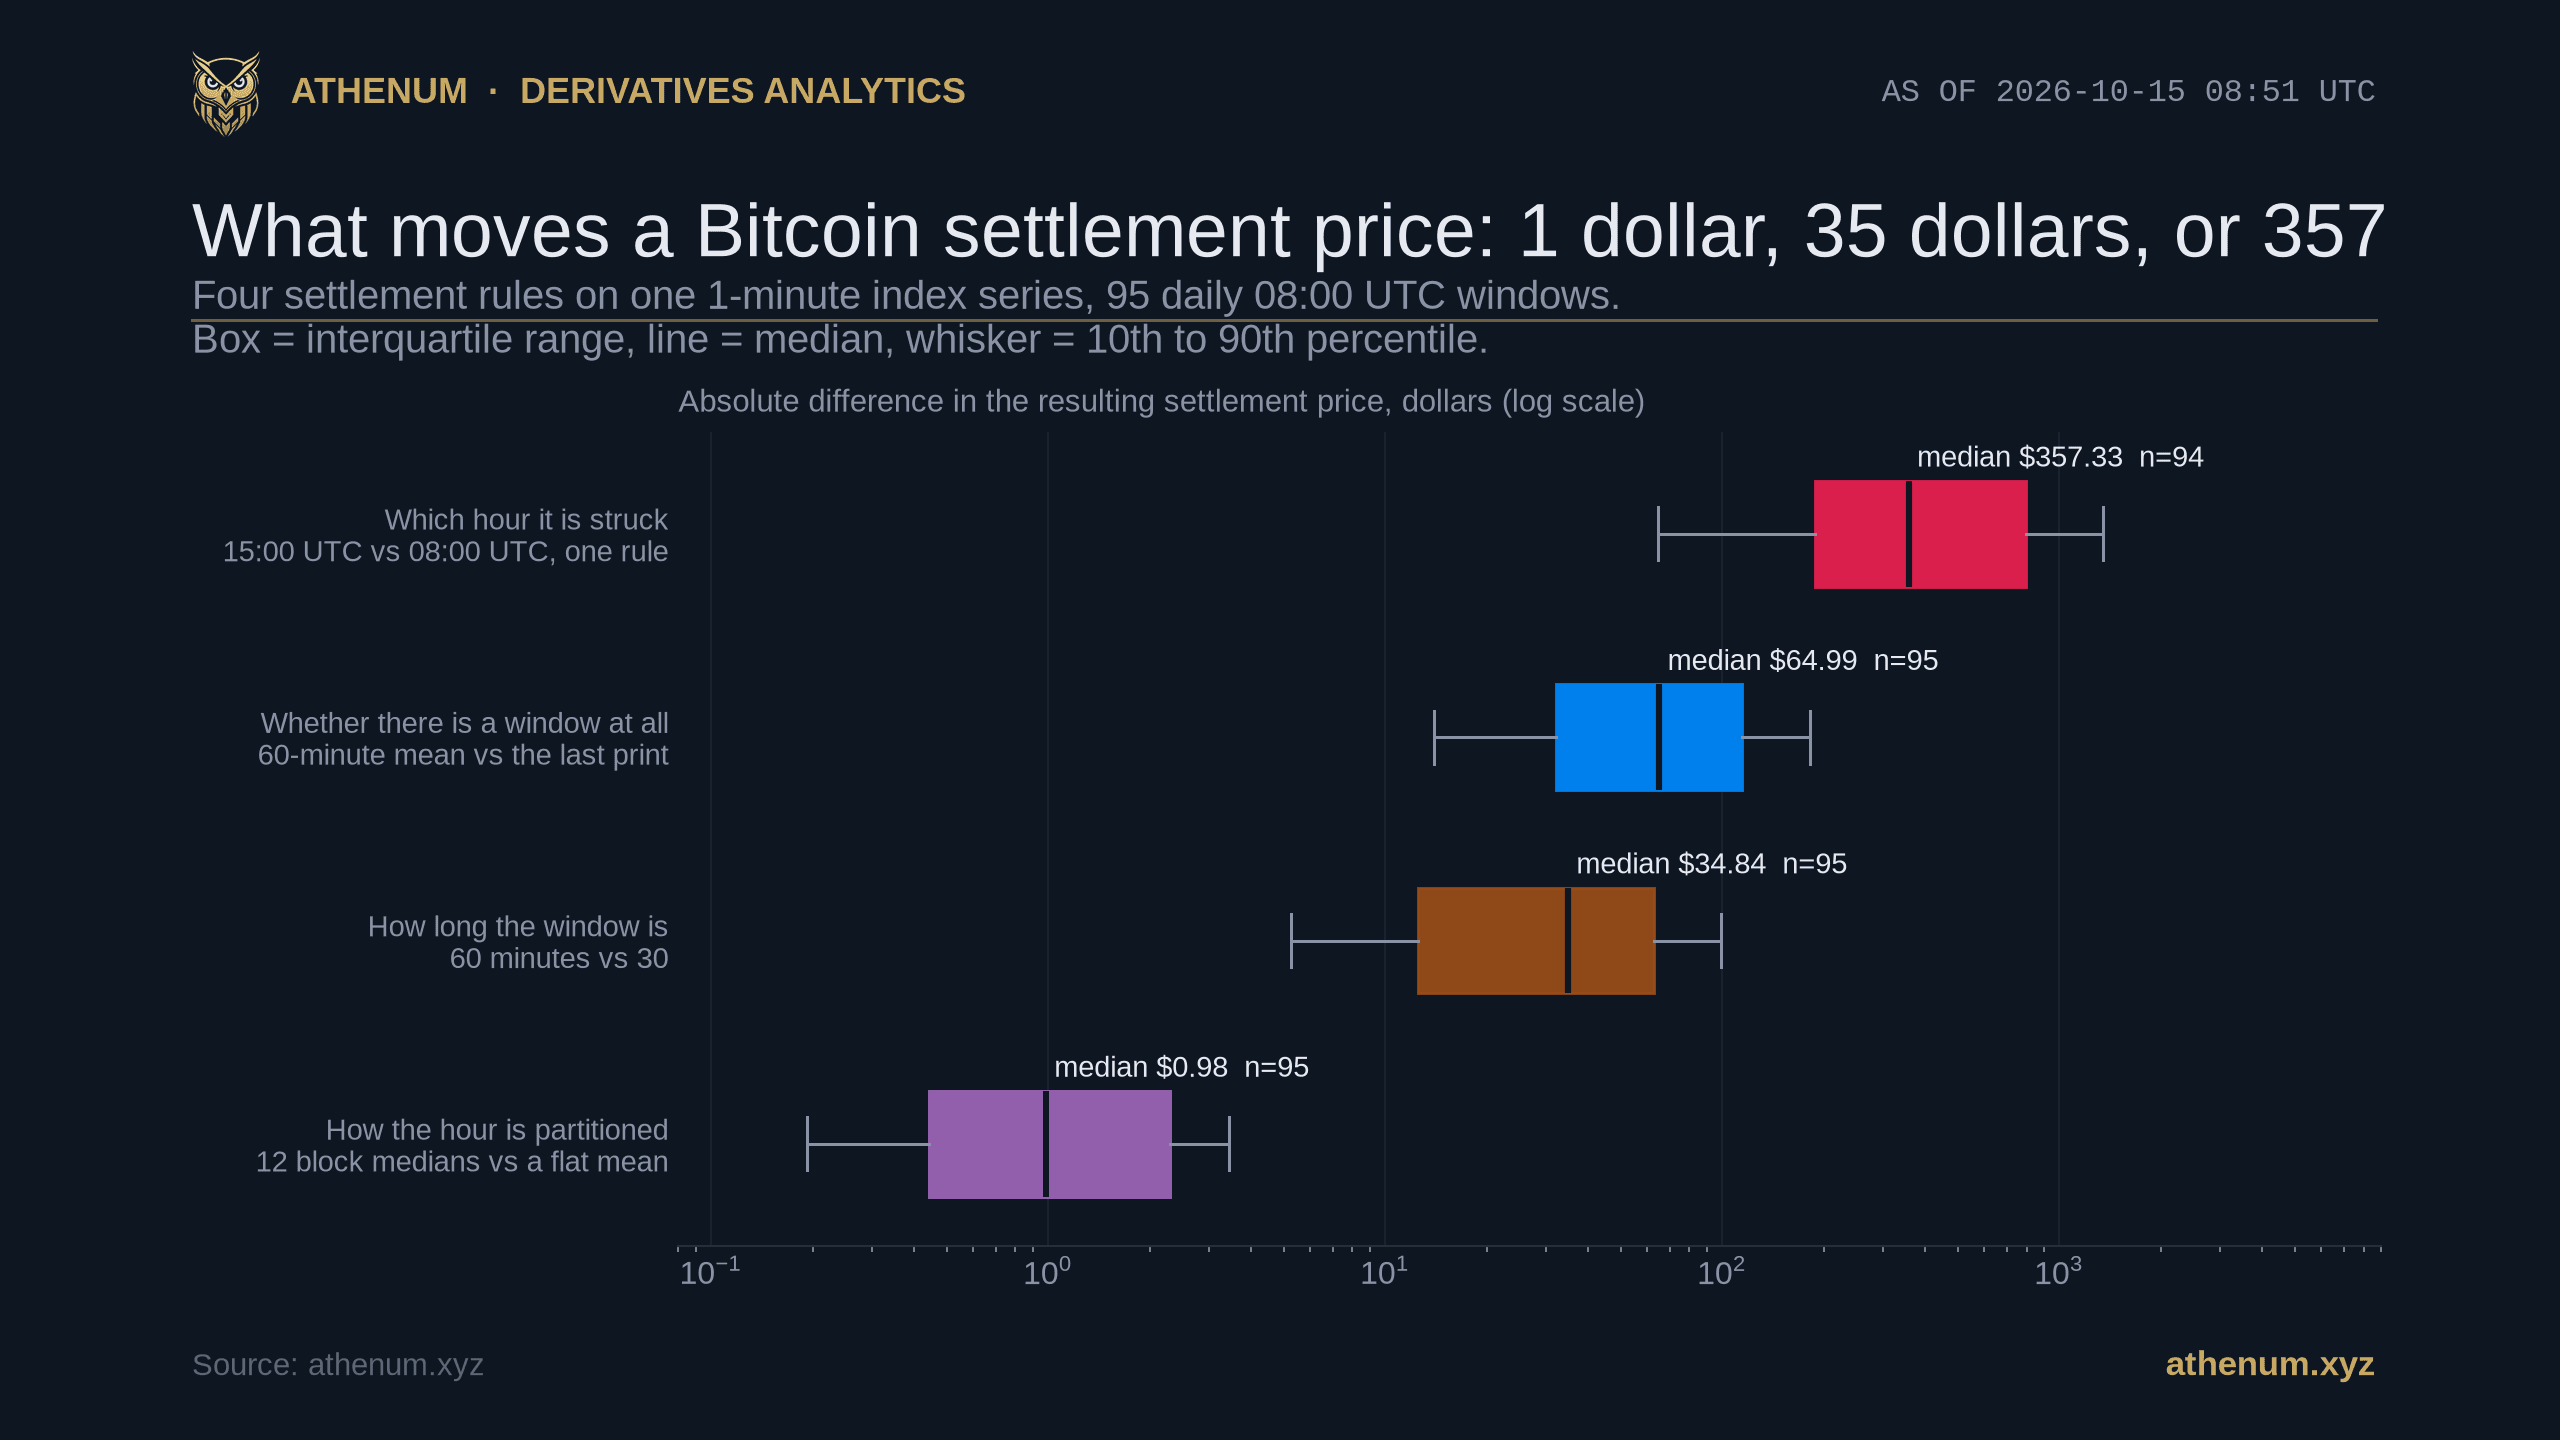
Bitcoin Realized Volatility Is 40.5 Percent, Plus or Minus 9
Realized volatility is published everywhere as a single number and almost never with an interval. We measured Bitcoin's, then measured how much every choice behind it moves the answer. The question here is whether a whole window summary statistic stays put when you re-partition the same tape, which is a different question from whether the hour of day carries return, and we treat it as such throughout.

Funding Rate Cap: Once on Bitcoin in Seven Years, Routinely on the Long Tail
Every crypto perpetual publishes a maximum funding rate, and almost nobody checks how often it is actually reached. Across all 7,609 settlements of Binance's BTCUSDT perpetual, the cap was reached once, on 2020-02-12, and the floor once, on 2020-03-13. Smaller contracts reach theirs dozens of times a year, and reaching it does not cap the bill: on Binance, OKX and Bybit it switches the contract to hourly settlement, which multiplies the daily ceiling by eight.
Stop Trading Blind.
The traders who move first will shape how this product evolves. Start your free trial. No credit card required.