TLDR: Volume counts how many contracts changed hands over a period and resets each day; open interest counts how many contracts are still open right now and carries over. Volume is the speedometer — how fast the market is moving. Open interest is the odometer — how many traders are still on the road. A move backed by rising open interest has fresh positioning behind it; the same move on falling open interest is mostly old positions being unwound. Read the two together and you can tell conviction from churn. This is education only, not a buy or sell call.
Most traders glance at volume, nod, and move on. Open interest gets ignored, or worse, conflated with volume as if they were the same activity number. They are not. They measure two different things about a futures market, and the gap between them is where a lot of the useful signal lives. Here is how to read each one, and what their combinations tend to mean.
What is the difference between open interest and volume?
They answer two different questions about the same market.
Volume is the total number of contracts traded over a window — a day, an hour, a week. Every time a contract changes hands it adds to volume, and at the end of the period the count resets to zero and starts again. Volume measures *activity*: how much trading happened.
Open interest is the total number of contracts that are currently open and not yet closed or settled. It is cumulative, not periodic. When a new buyer and a new seller create a fresh contract, open interest rises by one. When both sides close, it falls by one. When an existing holder simply passes their position to a new trader, open interest does not change at all — the contract just changed owners. Open interest measures *commitment*: how much exposure is still live.
The cleanest analogy comes from the data desks: volume is a speedometer and open interest is an odometer. One tells you how fast the market is moving; the other tells you how many participants are still in the car.
Why does open interest matter if I already watch volume?
Because volume alone cannot tell you whether activity is building positions or just recycling them.
Picture a contract that trades 500,000 lots in a session, but open interest barely moves. That means almost all of that trading was existing participants entering and exiting intraday — a busy, liquid, but ultimately non-committal day. Now picture a quieter session with lower volume but clearly rising open interest. Fewer trades, but a larger share of them created *new* outstanding positions. The second day added genuine exposure to the market; the first mostly churned it.
That distinction is invisible if you only watch volume. Open interest is the metric that answers the follow-up question volume always raises: *was anyone actually committing, or just trading?*
What does rising open interest mean?
Rising open interest means new contracts are being created — on net, money is entering the market and fresh positions are being opened. Falling open interest means contracts are being closed faster than new ones open — exposure is leaving the market.
On its own that is direction-neutral: open interest can rise whether the new positions are long or short, because every contract has one of each. To read it directionally you pair it with price. The standard market-structure interpretations:
- Price up + open interest up — the advance is being funded by new positions. New money is leaning into the move, which reads as participation behind the trend. - Price up + open interest down — the advance is running on position-closing, often short covering, rather than fresh buying. That tends to be a less durable kind of strength. - Price down + open interest up — new positioning is building into the decline (fresh shorts, or longs being added into weakness). Pressure is being added, not removed. - Price down + open interest down — longs are capitulating and closing out. The selling is liquidation of old exposure rather than aggressive new shorting.
Treat these as tendencies, not laws. They describe what is *usually* happening under each combination; they do not predict the next candle.

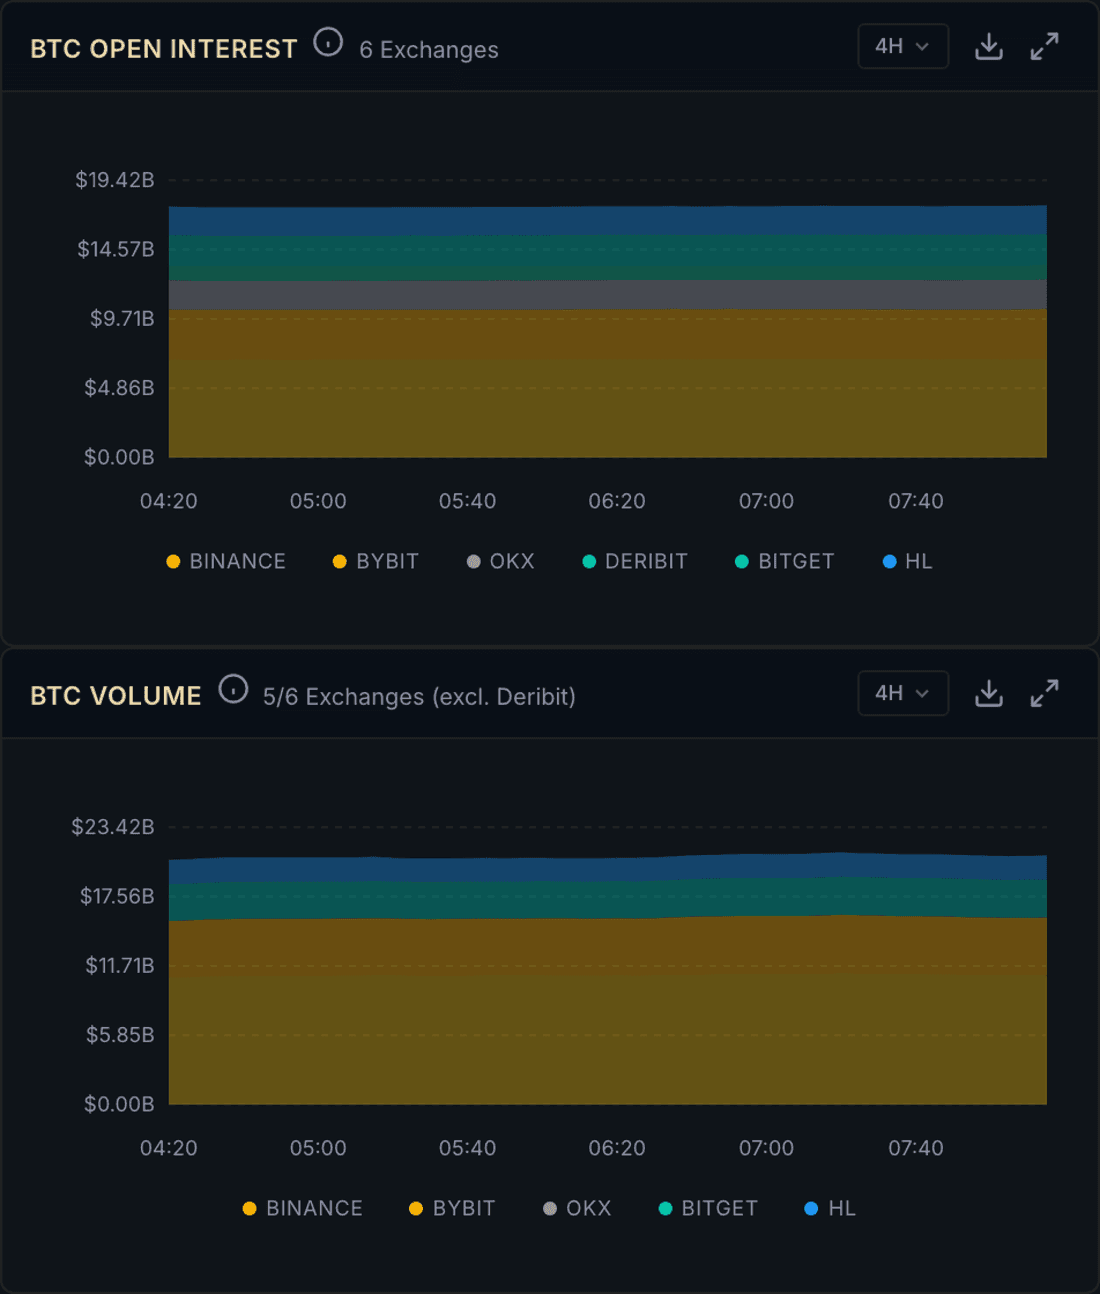
BTC futures open interest across major venues. Source: Athenum.
How do volume and open interest work together?
Use volume to gauge the intensity of a session and open interest to gauge what that intensity built.
A breakout on heavy volume *and* expanding open interest is the textbook "supported" move: lots of activity, and that activity is laying down new positions. A breakout on heavy volume but flat or falling open interest is a warning that the move is being driven by churn and unwinding rather than fresh conviction — the kind of move that more often fades. Low volume with quietly rising open interest, by contrast, can mark patient accumulation: not much noise, but exposure steadily building underneath.
Volume tells you *how loud* the session was. Open interest tells you *what got built*. Neither is complete without the other.
Why does the venue set matter?
Both metrics are reported per exchange, and any single venue is only a slice of the market. A spike in open interest on one exchange can be a venue-specific quirk — a basis trade, a market maker rebalancing — rather than a market-wide build. Reading open interest and volume aggregated across many venues is what turns a local reading into a market-wide one. Athenum aggregates open interest and volume across the major derivatives exchanges so the build-or-unwind read reflects the whole market rather than one book, and the order-flow view shows where that volume turns directional.
The honest caveat
Open interest and volume describe structure, not destiny. Rising open interest into a rally can mean a strong trend — or a crowded one that unwinds violently. High volume can mark a true breakout or a bull trap. These metrics are most useful as context for what price is doing, read alongside funding, liquidity and basis, not as standalone triggers. The point is not to predict the next move; it is to know whether the last one was built on commitment or on churn.
*Education only. Not investment advice. No buy or sell recommendation is made or implied.*
Sources: - CoinGlass, "Open interest vs volume in crypto" explainer. - BitMEX Blog, "Understanding Open Interest and Volume in Crypto Trading." - MetroTrade, "Futures Trading Basics: Open Interest vs Volume." - CME Group education, "Understanding Open Interest."
One terminal. All the data.
Liquidations, orderbook depth, whale walls & open interest from 4 exchanges, all real-time, in one place.
No credit card required
